データ探索
On a deployment's Monitoring > Data exploration tab, you can interact with a deployment's stored data to gain insight into model performance and use that data to calculate custom metrics. The Data Exploration Summary includes the following functionality, depending on the deployment type:
Tab visibility
For Predictive AI deployments, the Data Exploration Summary page doesn't include sub-tabs. The tabs to switch between Data export and Data quality only appear in Generative AI deployments.
| 機能性 | 説明 |
|---|---|
| データのエクスポート | For Predictive AI and Generative AI deployments, download a deployment's stored data including training data, prediction data, actuals, and custom metric data. |
| データ品質 | For Generative AI deployments only, assess the quality of a Generative AI model's responses based on user feedback and custom metrics. |
データの要件
To use the Data exploration tab, the deployment must store prediction data. Ensure that you enable prediction row storage in the data exploration (or challenger) settings. The Data exploration tab doesn't store or export Prediction Explanations, even if they are requested with the predictions.
Configure data exploration range
In the deployment from which you want to export stored training data, prediction data, or actuals, click the Monitoring > Data exploration tab and configure the following settings to specify the stored training data, prediction data, or actuals you want to export:
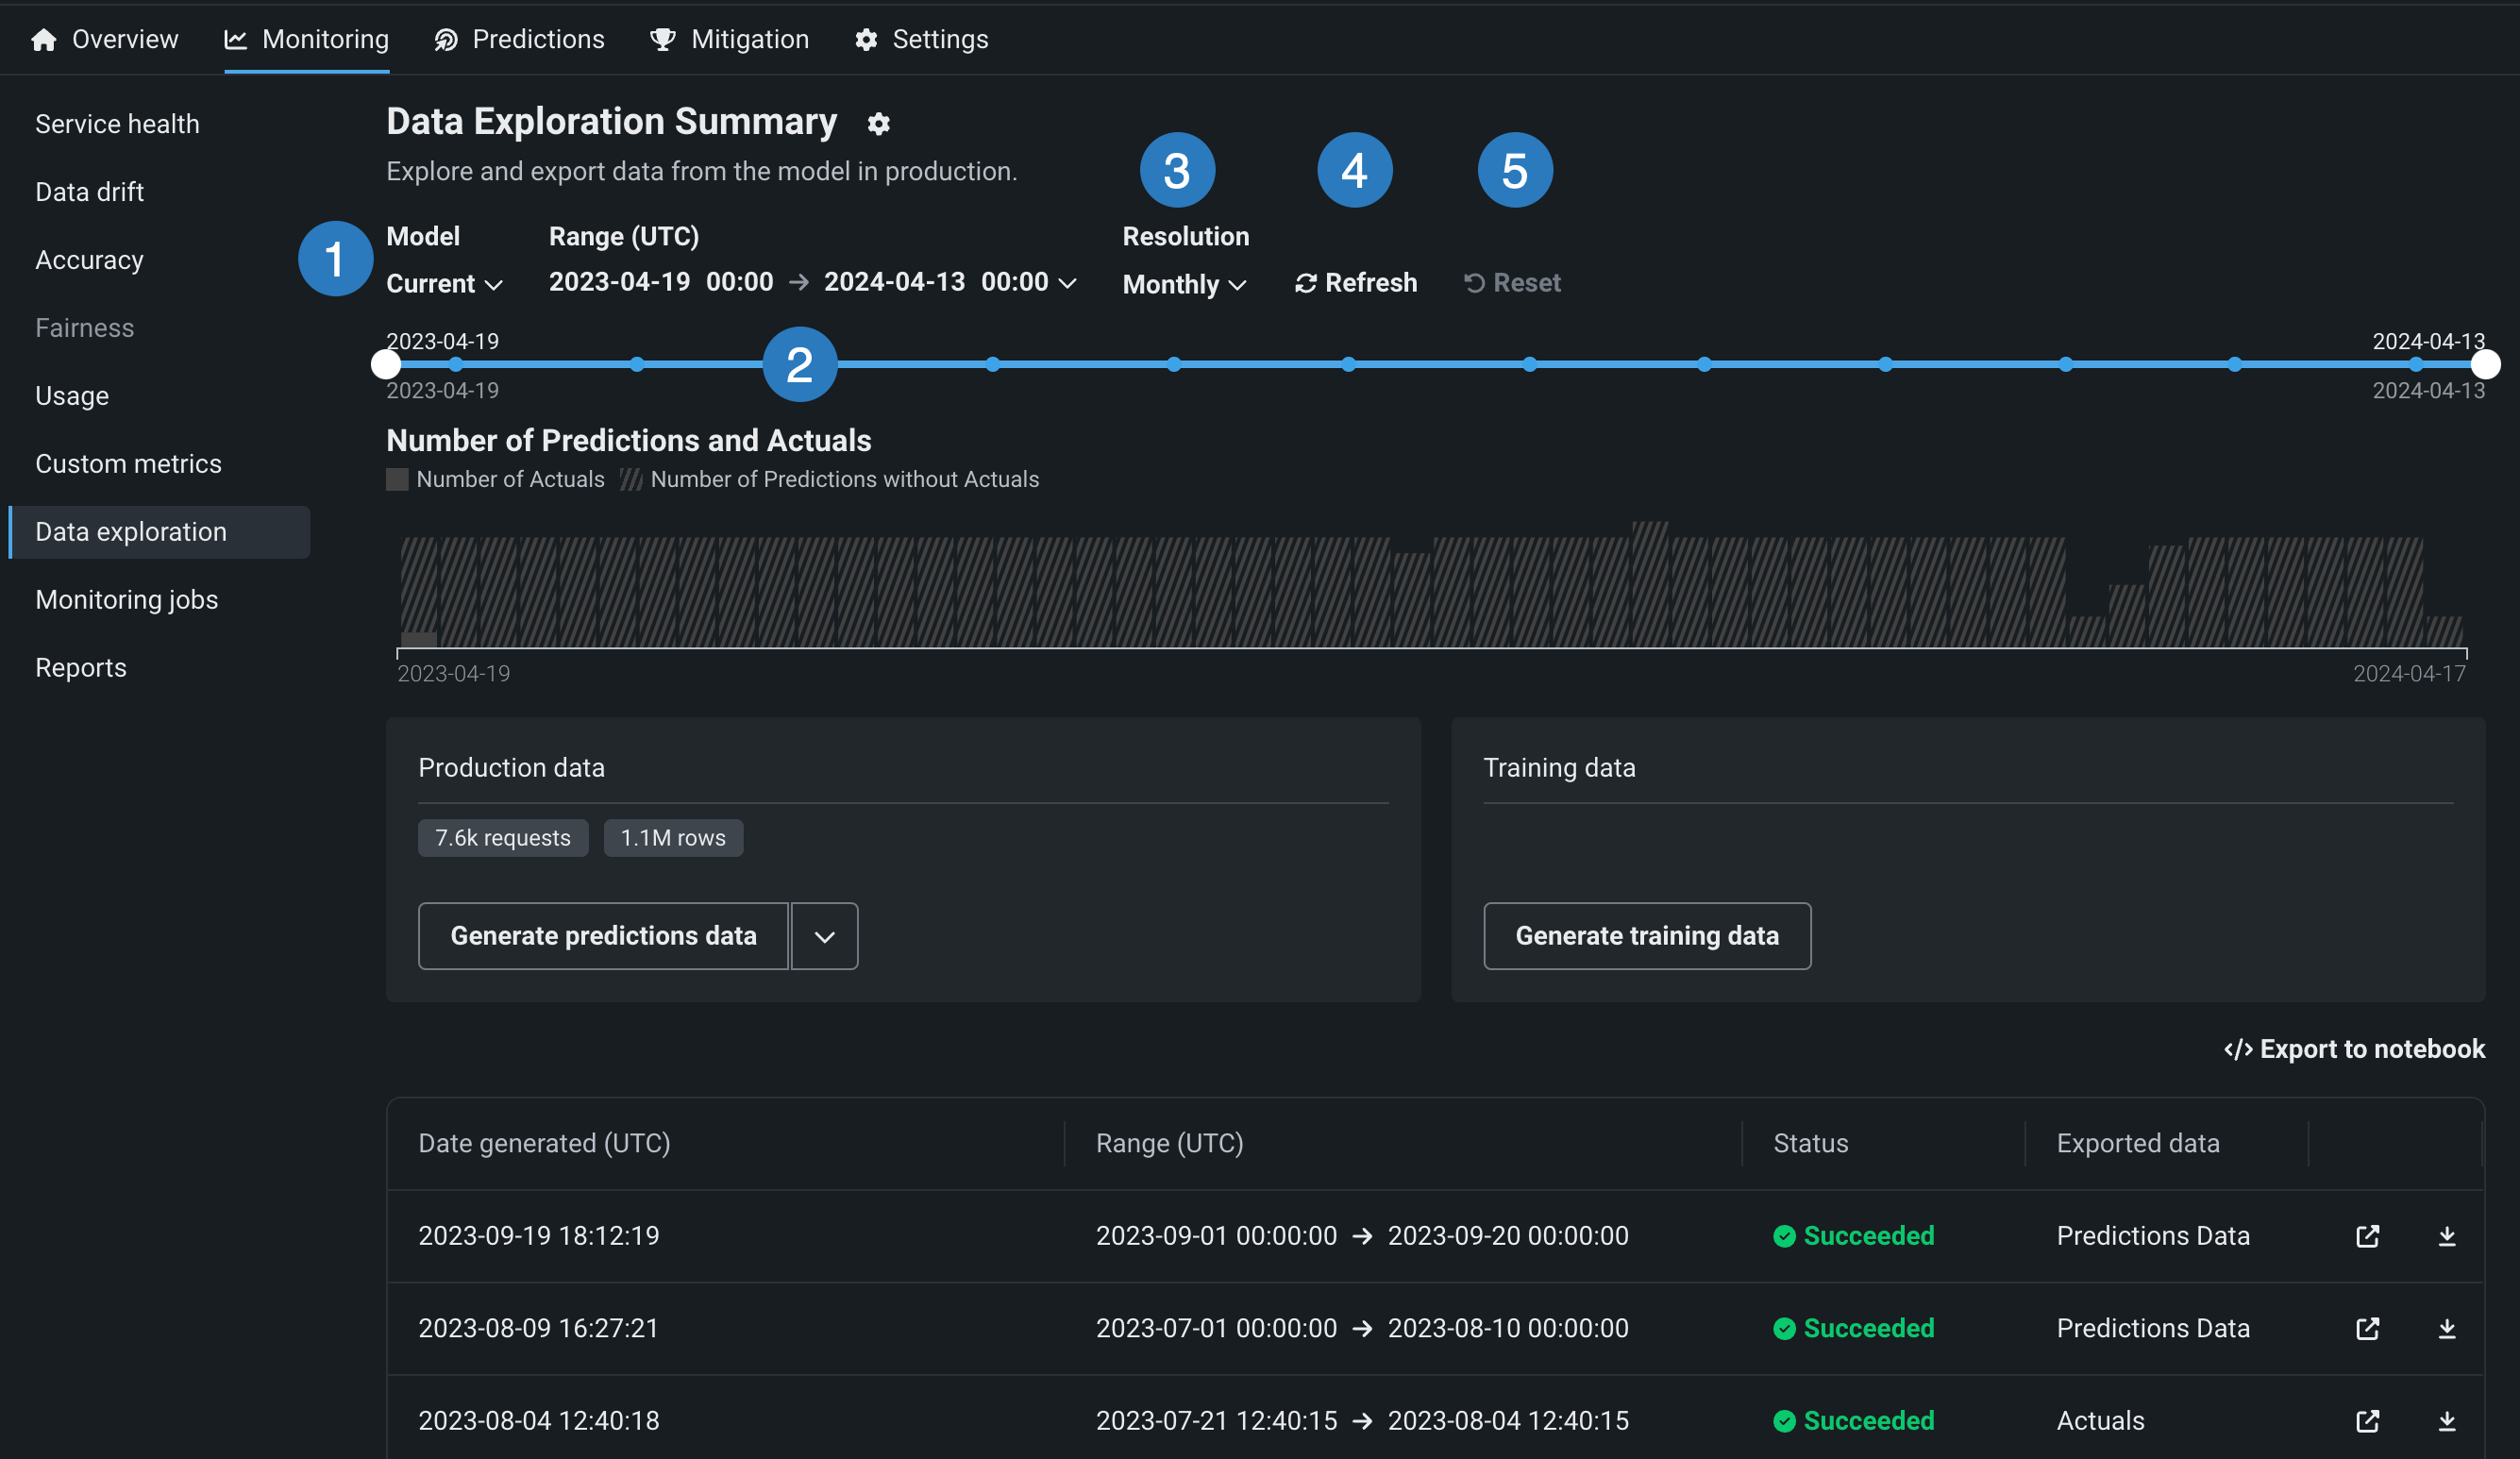
| 設定 | 説明 | |
|---|---|---|
| 1 | モデル | 予測データをエクスポートするデプロイのモデル(現在または以前)を選択します。 |
| 2 | 範囲 (UTC) | 予測データをエクスポートする期間の開始日と終了日を選択します。 |
| 3 | 単位 | 日付スライダーの時間単位を選択します。 選択した時間範囲に基づき、単位を毎時、毎日、毎週、毎月から選択します。 時間範囲が7日を超える場合、単位を毎時にすることはできません。 |
| 4 | 表示を更新 | Refresh the data exploration tab's data. |
| 5 | リセット | Reset the data exploration settings to the default. |
デプロイデータのエクスポート
On the Data Exploration Summary (or, for Generative AI deployments, the Data export tab of the Data Exploration Summary), you can download a deployment's stored data. This can include training data, prediction data, actuals, and custom metric data. You can use the exported data to compute and monitor custom business or performance metrics on the Custom metrics tab or outside DataRobot. カスタム指標のためにデプロイデータをエクスポートするには、デプロイに予測データが保存されていることを確認し、指定された時間範囲のデータを生成して、そのデータを表示またはダウンロードします。
Export a deployment's production data
To access deployment data export for prediction data, actuals, or custom metric data, on the Data Exploration Summary page, locate the Production data panel. On the Production data panel, in the Generate button, click the down arrow and select one of the data generation options. The availability of the following options depends on the data stored in the deployment for the model and time range selected:

| オプション | 説明 |
|---|---|
| すべての実運用データ | For Generative AI deployments, generate all available production data (predictions, actuals, custom metrics) for the specified model and time range. |
| 予測 | Generate prediction data for the specified model and time range. |
| 実測値と予測値のペア | Generate actuals paired up with the related predictions for the specified model and time range. |
| カスタム指標 | For Generative AI deployments, generate available custom metric data for the specified model and time range. |
本機能の提供について
Custom metric data export is off by default. この機能を有効にする方法については、DataRobotの担当者または管理者にお問い合わせください。
Feature flag: Enable Data Quality Table for Text Generation Target Types, Enable Actuals Storage for Generative Models (Premium feature)
Production data appears in the table below the panels. You can identify the data type in the Exported data column.
予測データと実測値に関する注意事項
予測データまたは実測値を生成するときは、以下の点を考慮してください。
-
予測データの生成時にエクスポート可能な行数は、1回のエクスポートで最大20万行までです。 設定した時間範囲で予測データが20万行を超える場合は、範囲を縮小してください。
-
データレジストリで持つことができる予測エクスポート項目は、最大で100個までです。 エクスポート用の予測データを生成すると、データレジストリの予測エクスポート項目の数がその制限を超える場合は、データレジストリで古い予測エクスポート項目を削除してください。
-
時系列デプロイで予測データを生成する場合、2つの予測エクスポート項目がデータレジストリに追加されます。 1つは予測データ用、もう1つは予測結果用です。 The Data exploration tab links to the prediction results.
-
実測値データの生成時にエクスポート可能な行数は、最大で20万行までです。 設定した時間範囲で実測値が100万行を超える場合は、時間範囲を縮小してください。
-
データレジストリでは、実測値のエクスポート項目は最大100個まで可能です。 エクスポートする実測値データを生成することで、データレジストリ内の実測値エクスポートアイテムの数がその制限を超えた場合、古い実測値を削除してデータレジストリアイテムをエクスポートします。
-
最大10,000,000の実測値がデプロイ用に保存されます。したがって、その期間に実測値が現在保存されていない場合、古い実測値をエクスポートするとエラーが発生する可能性があります。
Export a deployment's training data
To access deployment data export for training data, on the Data Exploration Summary page, locate the Training data panel and click Generate training data to generate data for the specified model and time range:

トレーニングデータがトレーニングデータパネルに表示されます。 Click the down arrow to choose between Open training data and Download training data :

Review and download data
After the production or training data are generated, you can view or download the data. Production data appears in the table below the panels, where you can identify the data type in the Exported data column. Training data appears in the Training data panel.

| オプション | 説明 |
|---|---|
| Open the prediction data in the Data Registry. | |
| Download the prediction data. |
備考
You can also click Export to notebook to open a DataRobot notebook with cells for exporting training data, prediction data, and actuals.
エクスポートされたデプロイデータをカスタム指標に使用
エクスポートされたデプロイデータを使用して独自のカスタム指標を作成するには、エクスポートされたデータを含むCSVファイルから読み取り、エクスポートプロセスで自動的に生成された列を含む結果の値を使用して指標を計算するスクリプトを実行します。
この例では、エクスポートされた予測データを使い、DataRobotの予測タイムスタンプ(DR_RESERVED_PREDICTION_TIMESTAMP)をDateFrameインデックス(または行ラベル)として、30日間のtime_in_hospital特徴量の変化を計算およびプロットしています。 また、エクスポートされたトレーニングデータをプロットのベースラインとして使用します。
import pandas as pd
feature_name = "<numeric_feature_name>"
training_df = pd.read_csv("<path_to_training_data_csv>")
baseline = training_df[feature_name].mean()
prediction_df = pd.read_csv("<path_to_prediction_data_csv>")
prediction_df["DR_RESERVED_PREDICTION_TIMESTAMP"] = pd.to_datetime(
    prediction_df["DR_RESERVED_PREDICTION_TIMESTAMP"]
)
predictions = prediction_df.set_index("DR_RESERVED_PREDICTION_TIMESTAMP")["time_in_hospital"]
ax = predictions.rolling('30D').mean().plot()
ax.axhline(y=baseline - 2, color="C1", label="training data baseline")
ax.legend()
ax.figure.savefig("feature_over_time.png")
DataRobotの列参照
DataRobot は、エクスポート用に生成された予測データに、以下の列を自動的に追加します。
| 列 | 説明 |
|---|---|
DR_RESERVED_PREDICTION_TIMESTAMP |
予測のタイムスタンプが格納されます。 |
DR_RESERVED_PREDICTION |
連続値の予測値を示します。 |
DR_RESERVED_PREDICTION_<Label> |
分類の予測値を示します。 |
Explore deployment data quality
本機能の提供について
Data quality analysis is off by default. この機能を有効にする方法については、DataRobotの担当者または管理者にお問い合わせください。
Feature flag: Enable Data Quality Table for Text Generation Target Types, Enable Actuals Storage for Generative Models (Premium feature)
生成AIデプロイのデータ探索タブで、データ品質をクリックすると、関連付けIDが一致するプロンプト、回答、ユーザー評価、カスタム指標を調べることができます。 このビューでは、生成AIモデルの回答の品質に関するインサイトが、ユーザーによる評価と、実装した生成AIのカスタム指標に基づいて提供されます。


Prompt and response matching
To use the data quality table, define an association ID to match prompts with responses in the same row. データ品質分析は、同じ行で関連付けIDが一致するプロンプトと回答でのみ利用できます。集計カスタム指標データは除外されます。
Locate specific rows by filtering the table to only display rows containing Prompt values, Response values, or Actual values. Click Search to locate a specific row in the Data quality table by prompt:

Click the open icon to expand the details panel, displaying a row's full Prompt and the Response matched with the prompt by association ID:
