使用状況
モデルをデプロイし、本番環境で予測を行った後、モデルの品質とパフォーマンスを長期にわたって監視することは、モデルの有効性を維持するうえで非常に重要です。 この監視は、データドリフトタブと精度タブで行われ、大量の予測データを処理する必要があります。 予測データの処理には、遅延やレート制限が発生することがあります。 Track prediction processing progress on the Usage tab.
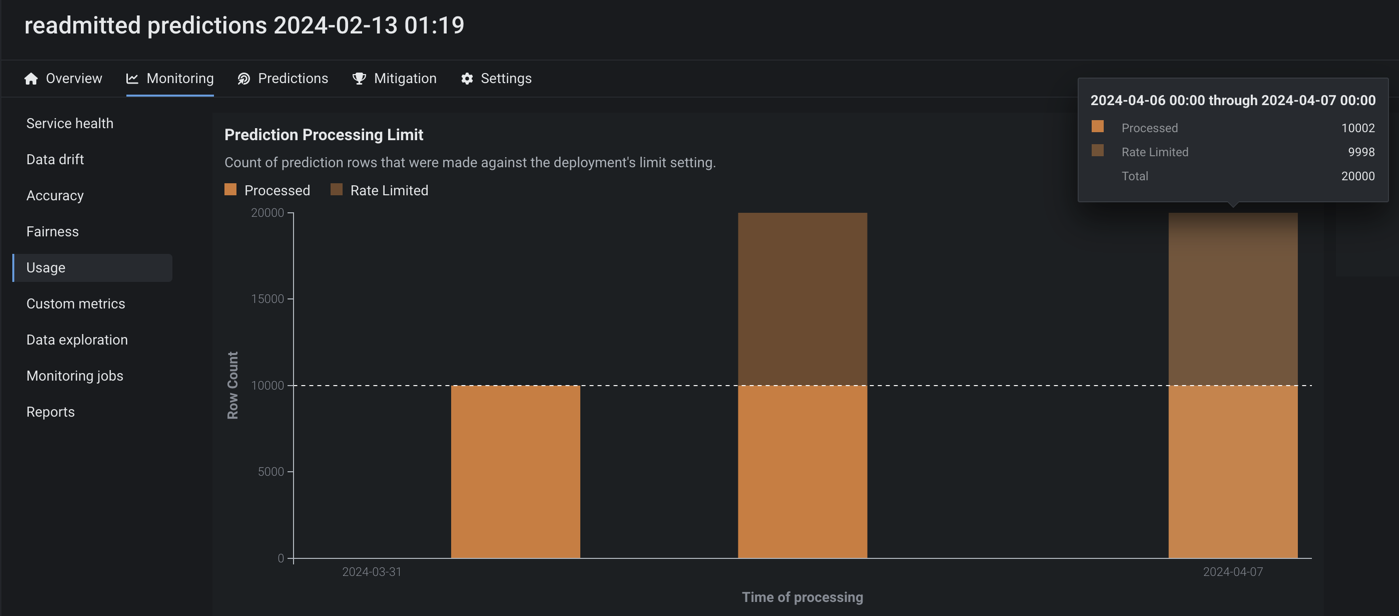
予測追跡チャート
モニタリング > 使用状況タブの左側に、予測追跡チャートが表示されます。これは、過去24時間または7日間の予測処理状況を示す棒グラフであり、処理済みの予測行、関連付けIDがない予測行、およびレート制限された予測行の数を追跡します。 選択したビュー(24時間または7日間)に応じて、ヒストグラムのビンは1時間または1日単位になります。
![]()
| チャートの要素 | 説明 | |
|---|---|---|
| 1 | 期間の選択 | 過去24時間または過去7日間のビューを選択します。 |
| 2 | ログスケーリングを使用 | 250,000行を超える予測を含むデプロイで、予測追跡チャートにログスケーリングを適用します。 |
| 3 | 予測データの受信日時 (X軸) |
ビンで表される時間範囲(日または時間単位)を表示し、その範囲内で受信した予測データの行を追跡します。 システムが処理用に予測を受信すると、予測値にタイムスタンプが付けられます。 この「受信日時」の値は、サービスの正常性、データドリフト、および精度のタイムスタンプとは異なります。 DataRobotの予測環境では、このタイムスタンプ値は予測タイムスタンプより若干遅れる場合があります。 エージェントのデプロイでは、タイムスタンプは、DataRobot APIがエージェントから予測データを受信した日時を表します。 |
| 4 | 行数 (Y軸) |
ビンの時間範囲内(日または時間単位)でタイムスタンプが付けられた予測行の数を表示します。 |
| 5 | 予測処理のカテゴリー | 予測行のステータスを追跡する棒グラフを表示します。
|
予測レート制限はどのように機能しますか?
The Usage tab displays the number of prediction rows subject to the monitoring rate limit of 100MB per hour. However, rate limiting only applies to prediction monitoring, all rows are included in the prediction results even after the rate limit is reached.
大規模監視での予測追跡
監視エージェントのデプロイでは、 大規模な監視を実施すると、予測行はこの棒グラフに表示されません。ただし、予測処理(チャンピオン)の遅延では、事前に集計されたデータが追跡されます。
予測追跡チャートで追加情報を表示するには、列にカーソルを合わせると、予測データを受信した時間範囲と、処理済みの行、レート制限された行、または関連付けIDがない行の数が表示されます。
![]()
予測値と実測値の処理遅延
使用状況タブの右側には、予測値の処理(チャンピオン)と実測値の処理の遅延情報が表示されます(実測値の処理の遅延は、デプロイのすべてのモデルが対象です)。
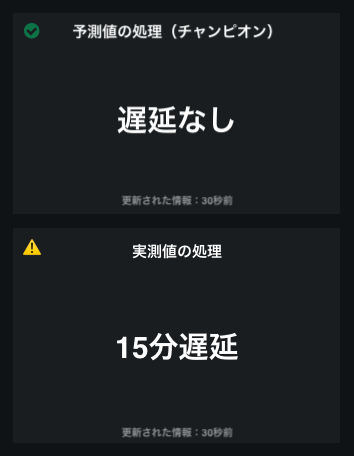
使用状況タブでは、ページを再読み込みすることなく、処理遅延が再計算されます。 更新された情報では、遅延情報が最後に更新された日時を確認できます。
Predictions and actuals upload limits
本機能の提供について
Predictions and actuals upload limits are off by default. Contact your DataRobot representative or administrator for information on enabling this preview feature.
Feature flag: Enable Configurable Prediction and Actuals Limits
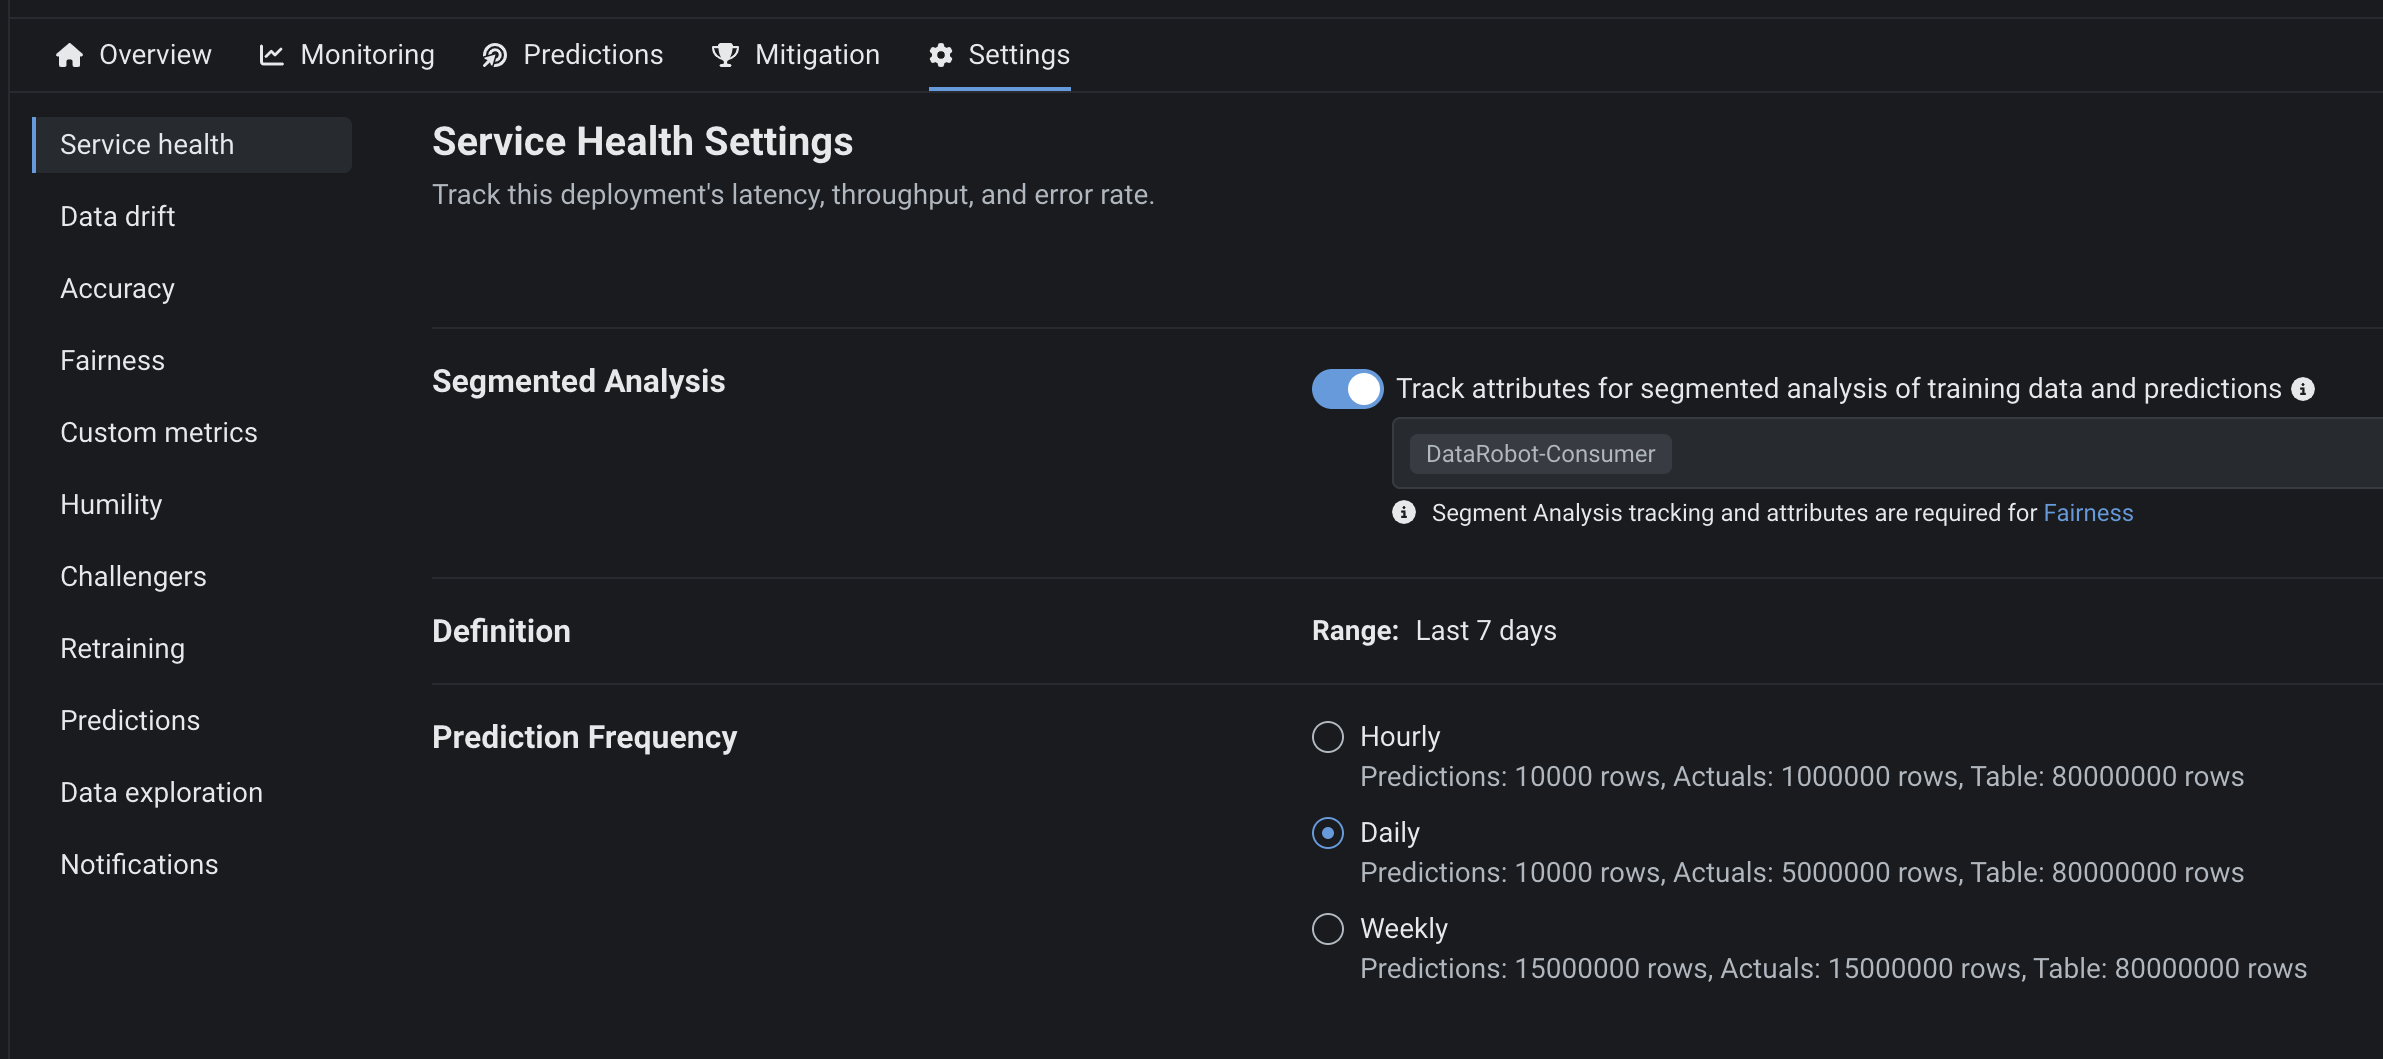
From the Usage tab, you can monitor the hourly, daily, and weekly upload limits configured for your organization's deployments. View charts that visualize the number of predictions and actuals processed and tiles that display the table size limits for returned prediction results.
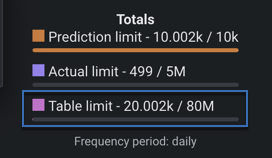
The Totals tile shows how many predictions and actuals have been processed relative to the configured interval limit (displayed at the bottom of the tile). Additionally, you can view the table size limit for returned prediction results. The table size limits the number of prediction rows stored in DataRobot's database for a deployment. DataRobot stores one row per prediction (or two, for binary classification deployments). For multiclass deployments, information for all classes is stored in one row. Note that the table limit does not change when you change the time interval limit (hourly, daily, weekly). Any request that exceeds the table limit will be rejected, regardless of the time.
If you reach the exact processing limit value (for example, uploading 50,000 actuals in an hour with 50,000 as the limit), and you make an additional request (uploading 10,000 more actuals), then DataRobot processes the additional request and none of the actuals are rate limited. However, DataRobot treats predictions differently because they are processed in smaller chunks. A small chunk is processed, while the remaining predictions are rate limited. For example, if you reached a 50,000 prediction limit and uploaded 50,000 more, a chunk of 1,000 predictions may be processed as part of the small chunk.
You can view the prediction limits configured for a deployment by navigating to the Settings > Service Health tab to know when you can make predictions next if you have already reached the processing limit.