Assess data quality with EDA
Learn how DataRobot performs Exploratory Data Analysis (EDA) and how to assess the quality of your data at each stage of EDA—EDA1 and EDA2.
Preparing your data is an iterative process. Even if you clean and prep your training data prior to uploading it to DataRobot, you can still improve its quality by assessing features during EDA.
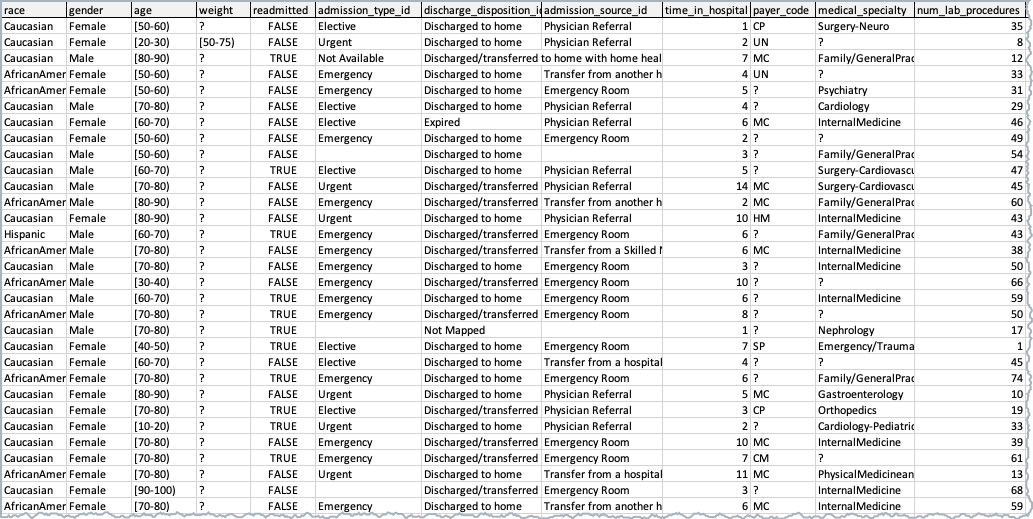
The sample dataset featured on this page contains patient data. The goal is to predict the likelihood of patient readmission to the hospital. The target feature is readmitted.
Stages of EDA
During EDA, DataRobot performs Data Quality Assessment. The assessment provides information about data quality issues that are relevant to the stage of model building you are performing. Click one of the following tabs to learn about the two EDA stages.
EDA1 (data ingest) occurs after you upload your data. EDA1 assesses the All Features list and detects issues like:
For more information on EDA1, see Exploratory data Analysis.
Once you click Start on the Data page, DataRobot performs another round of EDA. During this stage, DataRobot detects target leakage and non-linear correlations between the features and the target, which helps you analyze feature importance. EDA2 reports on the selected feature list. If a feature list is not selected, EDA2 reports on the default All Features list.
For more information on EDA2, see Exploratory data Analysis.
Load and view your dataset
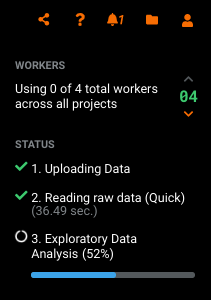
As soon as you load your dataset, creates a new project, and performs an initial EDA, generating summary statistics based on a sample of your data. View the progress in the Worker Queue on the right.
Working with large datasets
To learn how DataRobot handles larger datasets, see Fast EDA.
Once you import your data, click Explore the data or scroll down to see the features in your dataset.
DataRobot displays the features and provides summary information and statistics.
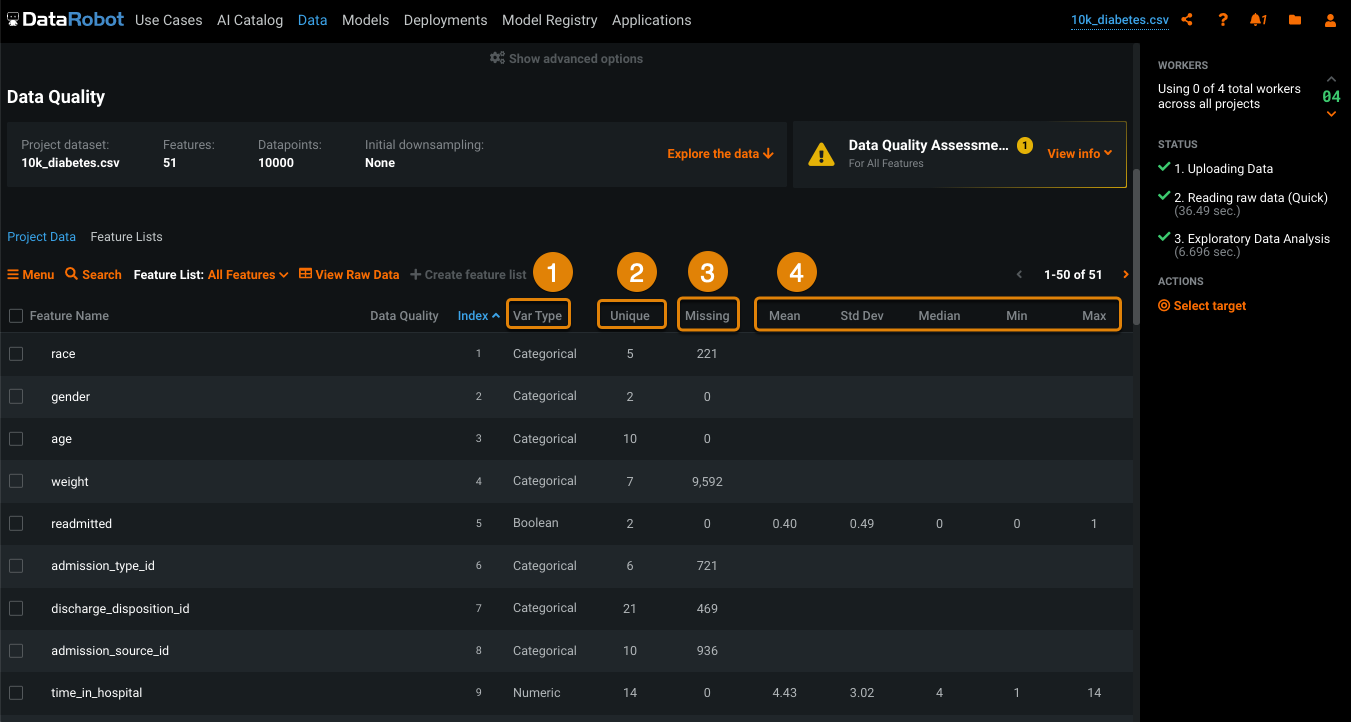
| Label | Description | |
|---|---|---|
| 1 | Var Type | The data type DataRobot identifies for the feature during EDA, for example, Numeric, Categorical, Boolean, Image, Text, and special features types like Date. |
| 2 | Unique | The number of unique values for the feature. |
| 3 | Missing | The number of missing values for the feature. |
| 4 | Mean, Std Dev, Median, Min, Max | DataRobot calculates these statistics for numerical features. |
Assess data quality after EDA1
EDA1 helps you catch data issues before you start modeling.
-
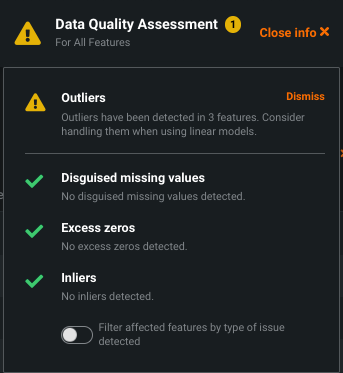
Above your feature list and to the right, click View info.
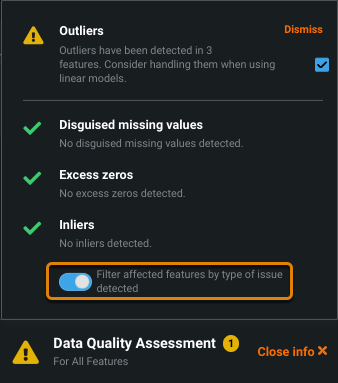
The Data Quality Assessment dropdown menu displays.
Tip
The Data Quality Assessment provides the following issue status flags:
- Warning
 : Attention or action required.
 - Informational
 : No action required.
 - No issue
 .
.
- Warning
-
(Optional) Click Filter affected features by type of issue detected and select particular issues to search for.
-
Scroll down to locate the features with issues.
If a feature has an issue, the issue flag displays in the Data Quality column. Hover over the flag to view the type of issue.
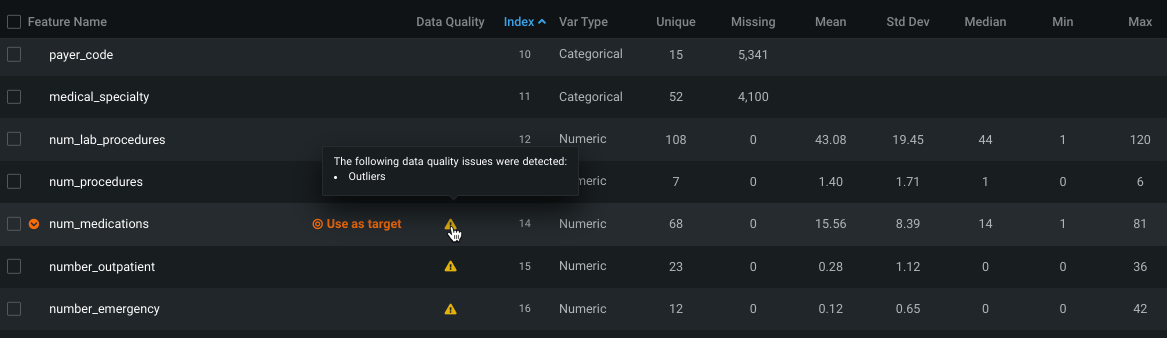
-
Click a feature that displays an issue flag, then use tools such as the Histogram, Frequent Values, and Feature Associations to explore further.
Assess data quality after EDA2
EDA2 kicks off after you set your target and start the modeling process.
-
Under What would you like to predict, enter your target feature.
Modeling modes
You can keep the mode set to the default, Quick Autopilot, or you can select a different modeling mode. You can also customize your modeling settings.
-
Click Start.
DataRobot performs a number of processing steps. Monitor the steps in the Worker Queue.
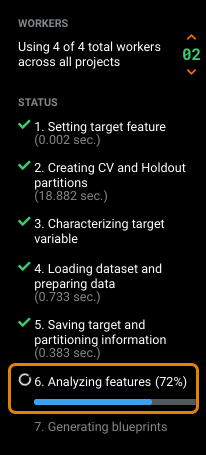
As soon as DataRobot finishes analyzing features, you can take a look at feature importance. DataRobot continues with blueprint generation.
Investigate feature importance
The importance bars show the degree to which a feature is correlated with the target. Importance is calculated using an algorithm that measures the information content of the variable. This calculation is done independently for each feature in the dataset.
Investigate feature importance to determine which features are most useful for building accurate models and which features you can remove from your training data.
-
In the Data tab, scroll down to the feature list.
-
Take a look at the Importance column.
The green bars indicate how closely a feature is related to the target.
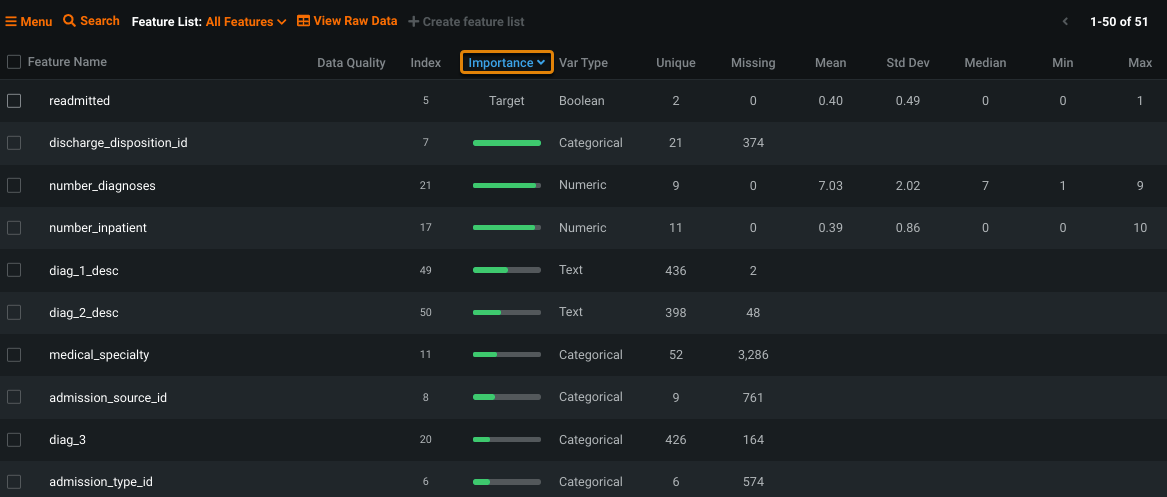
You might want to remove features that are unrelated to the target.
Related reading
To learn more about the topics discussed on this page, see:
- How DataRobot performs each stage of Exploratory Data Analysis (EDA).
- How common data quality issues are detected and surfaced in the Data Quality Assessment.
- Describes the checks DataRobot runs for the potential data quality issues.