Batch monitoring
You can view monitoring statistics organized by batch, instead of by time, with batch-enabled deployments. To do this, you can create batches, add predictions to those batches, and view service health, data drift, and accuracy statistics for the batches in your deployment.
Enable batch monitoring for a new deployment
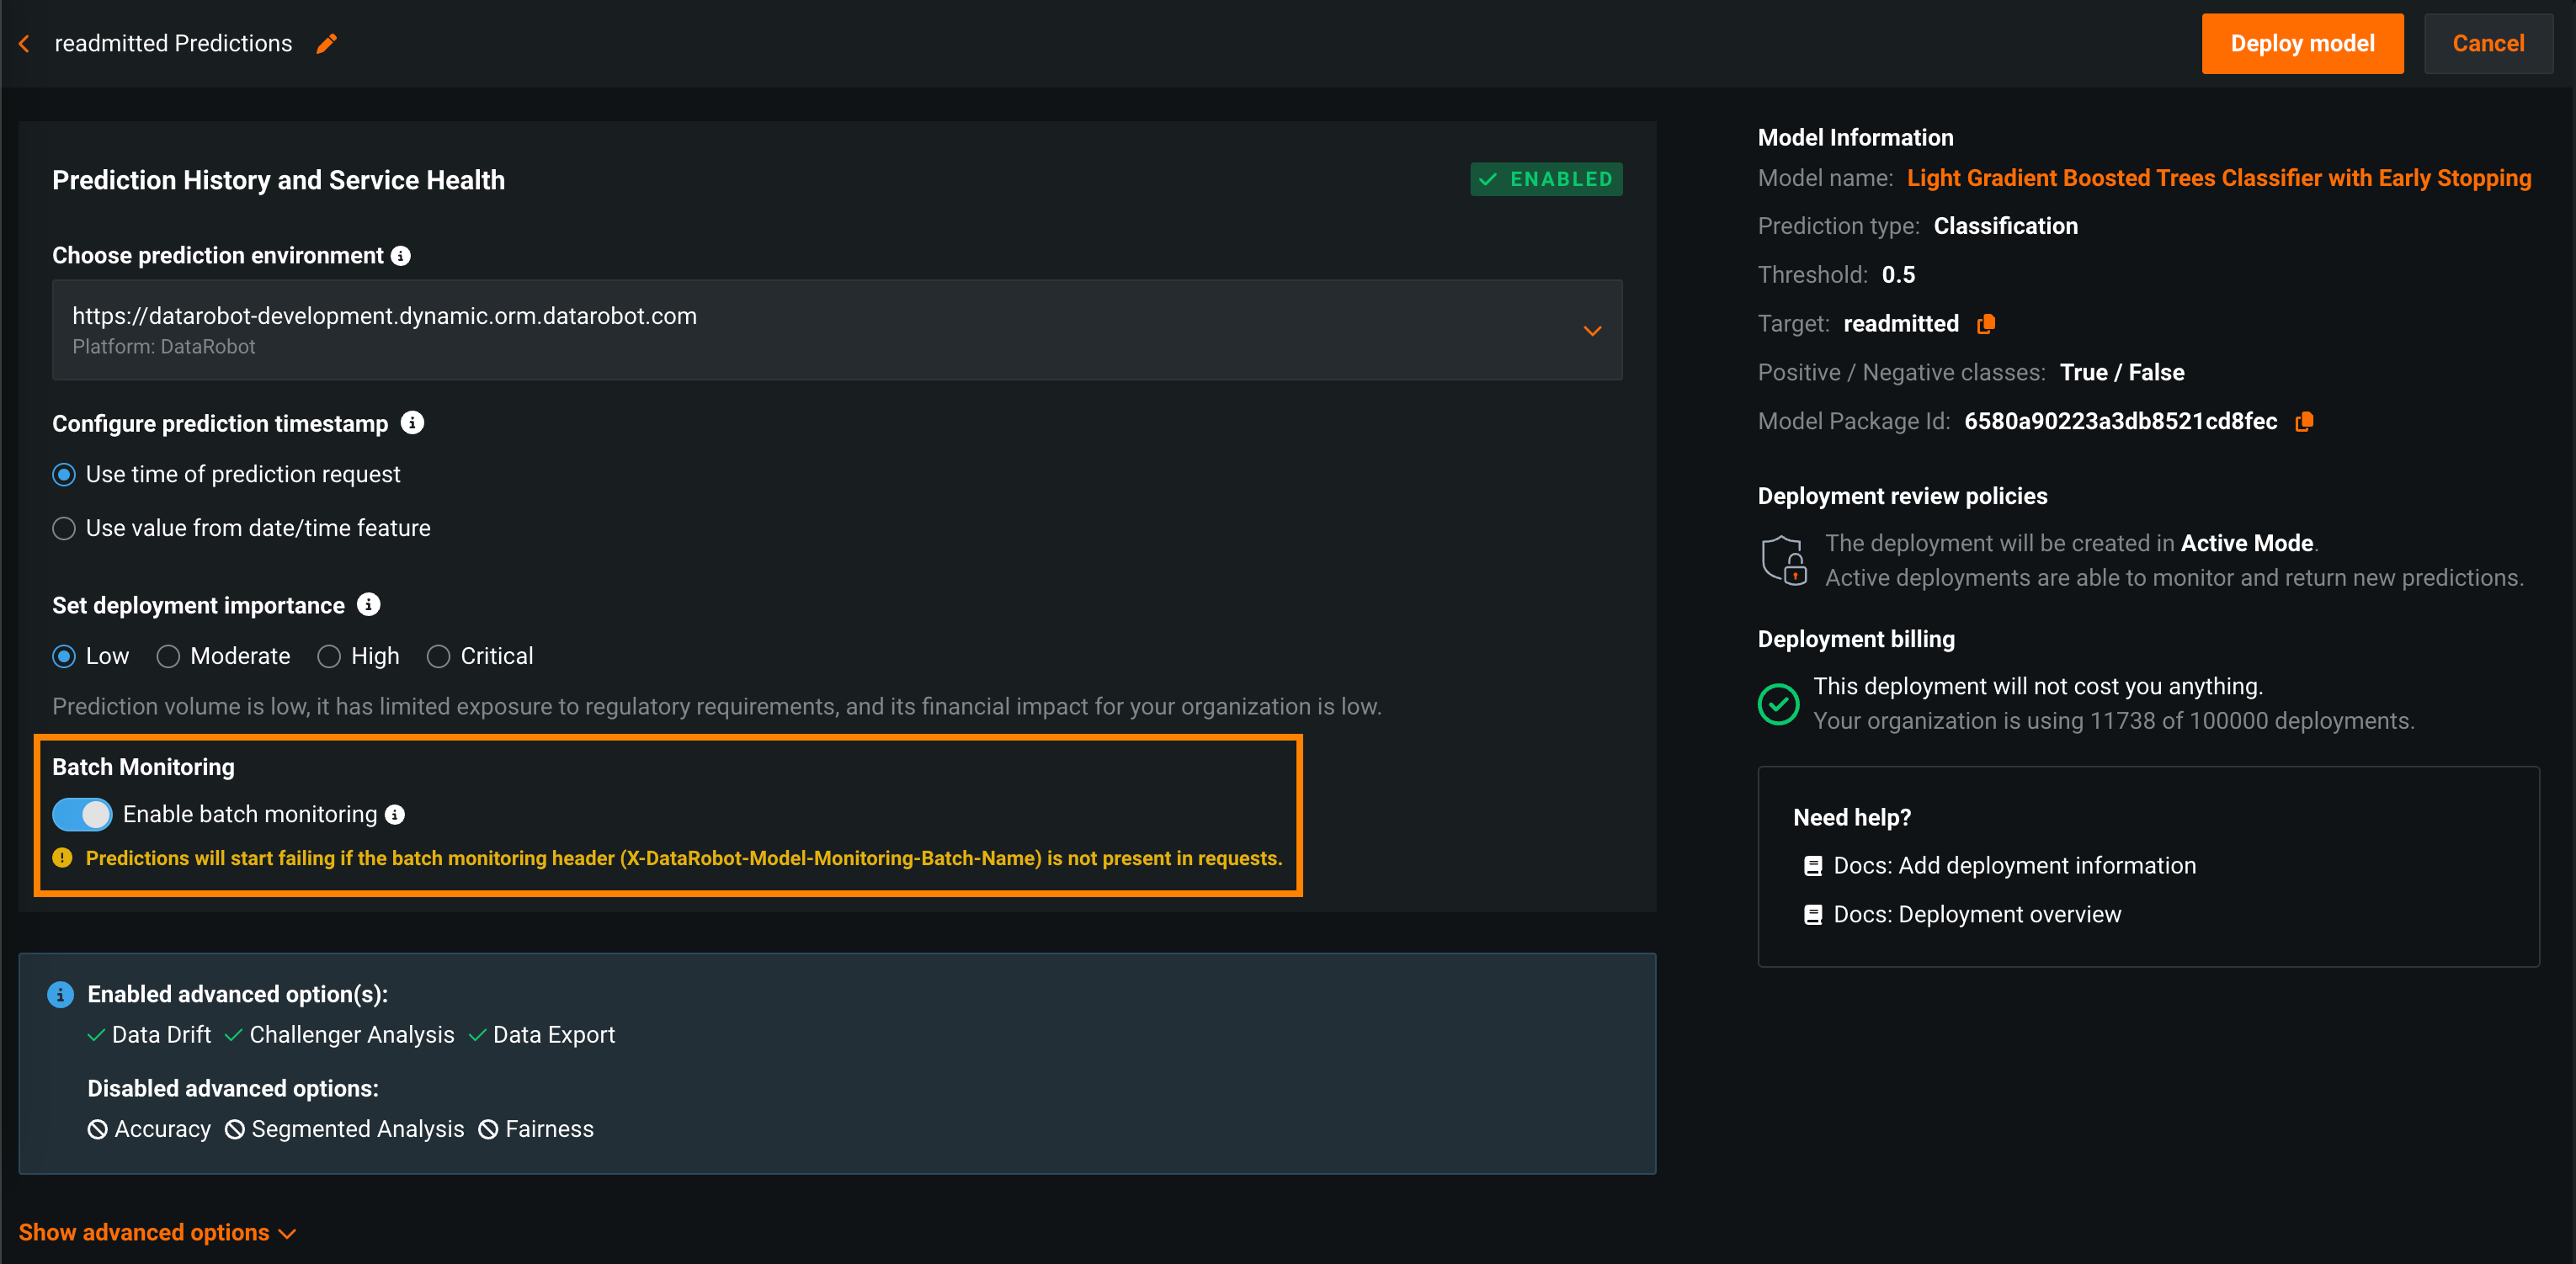
When you initiate model deployment, the Deployments tab opens to the deployment configuration page:
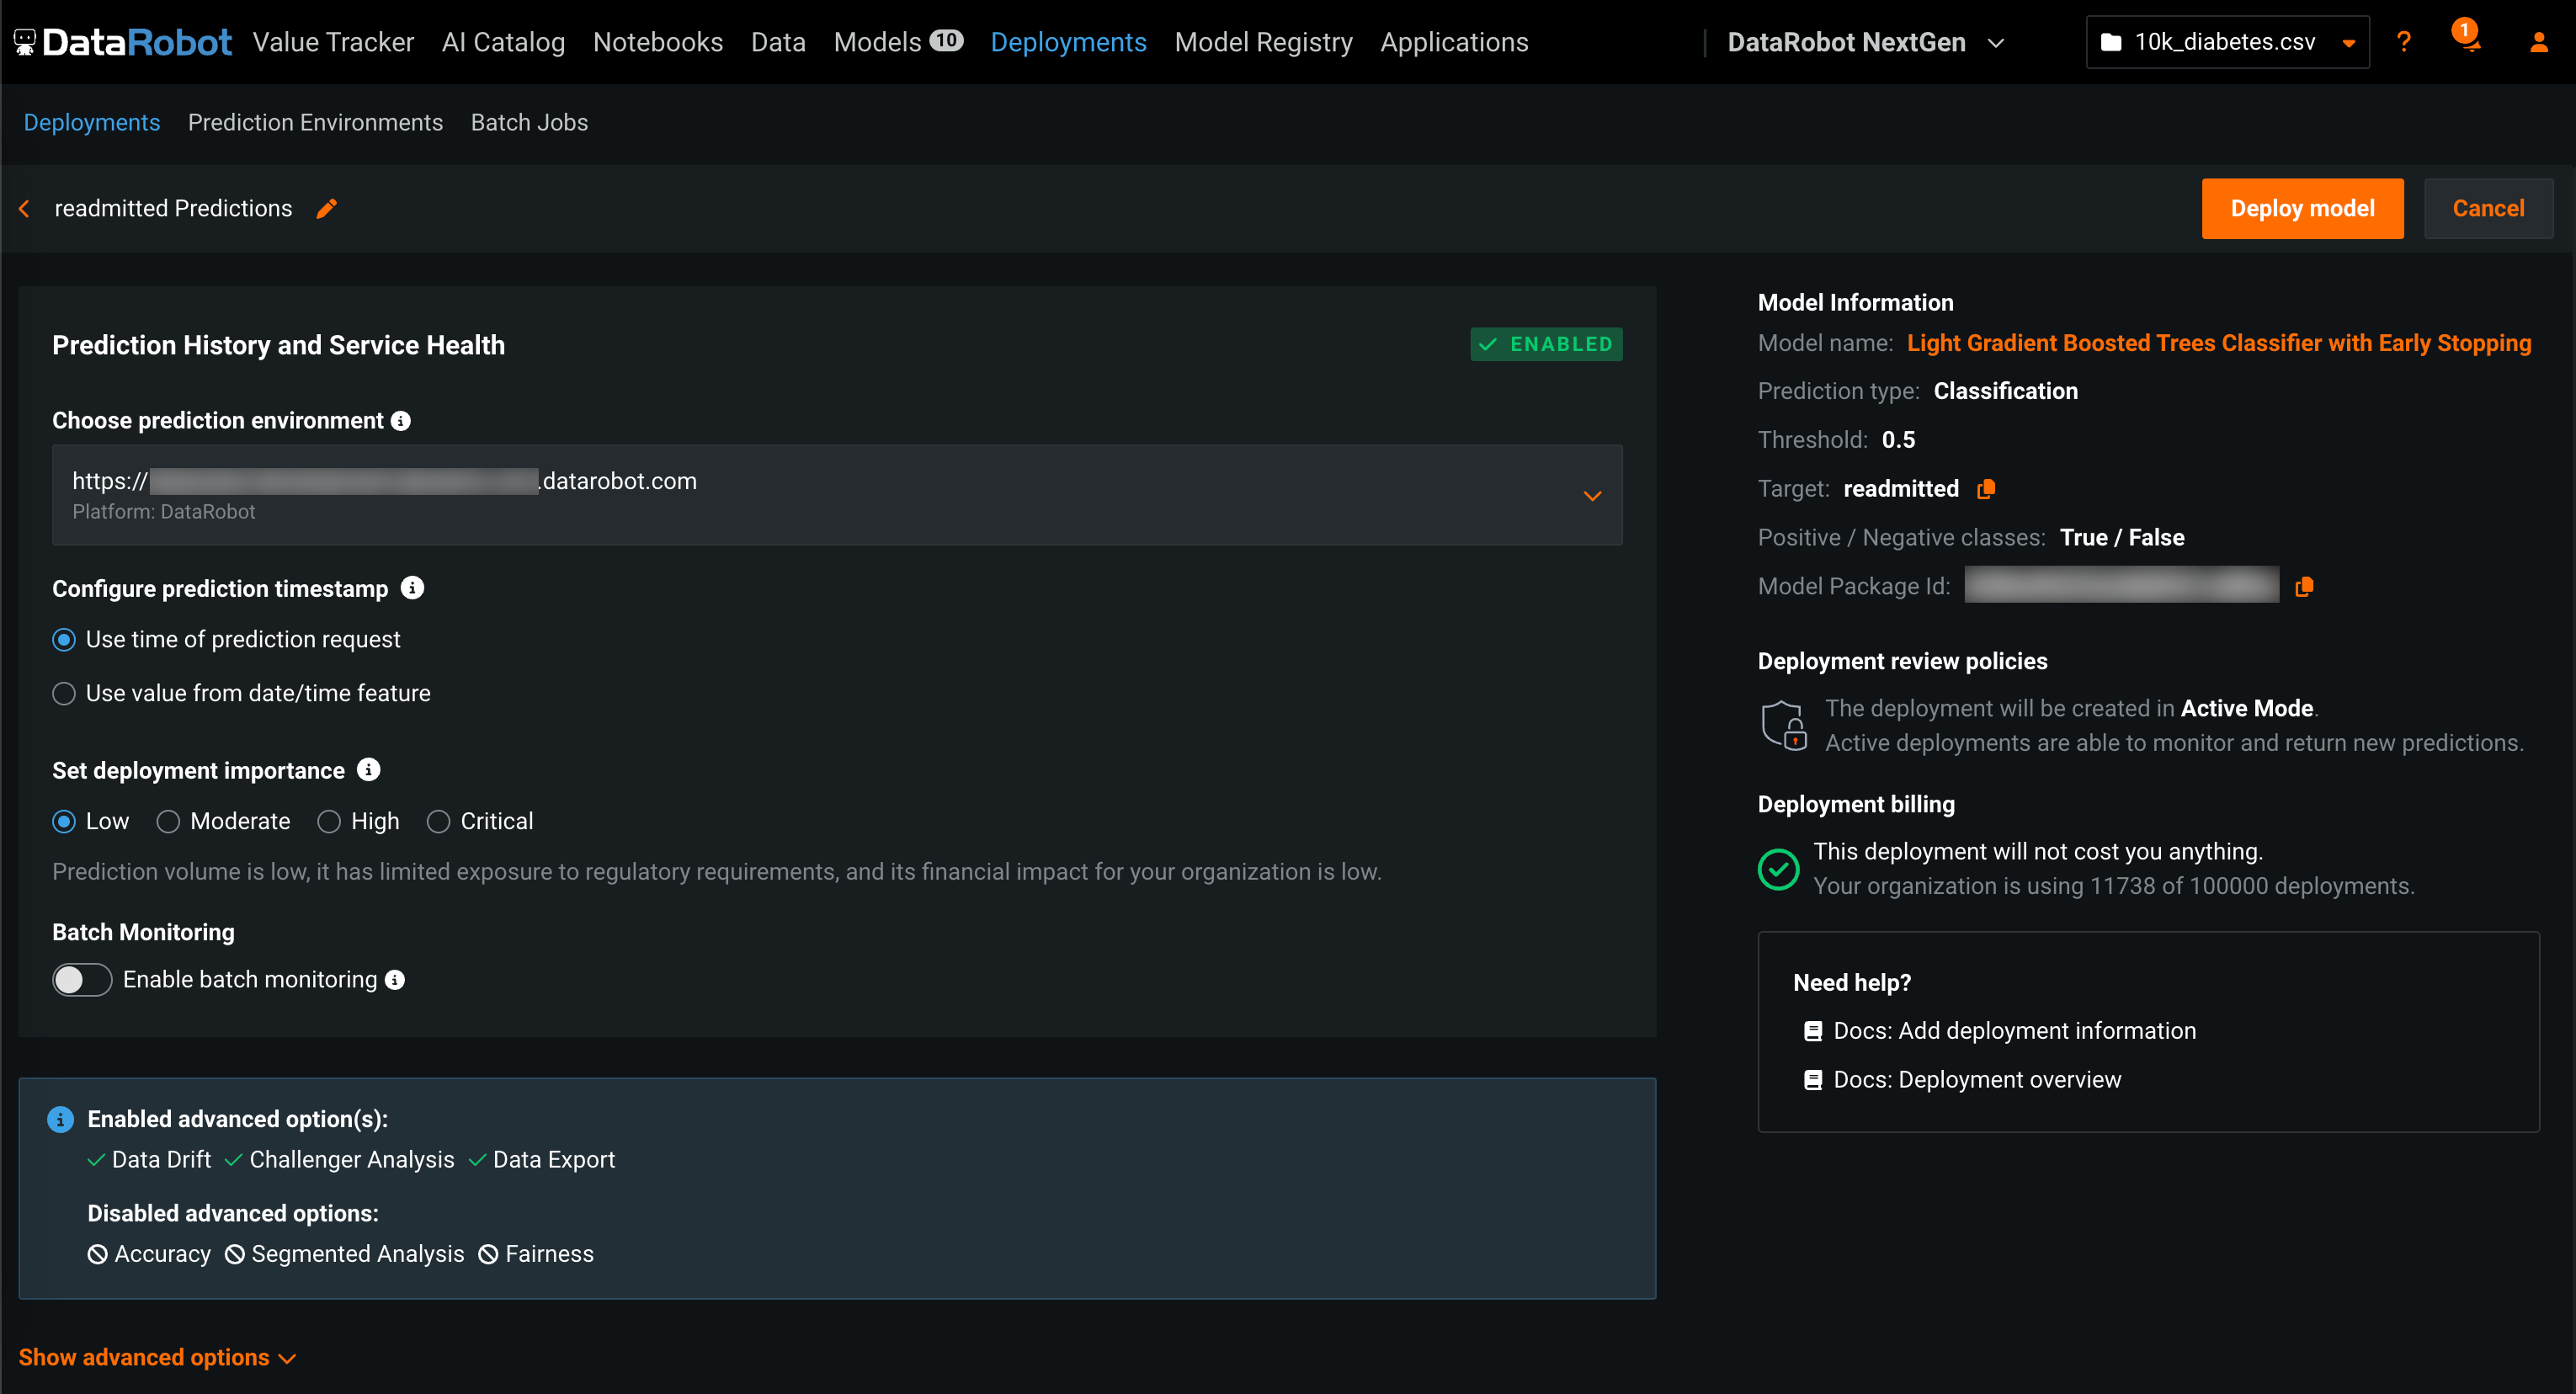
To enable batch monitoring for this deployment, in the Prediction History and Service Health section, locate Batch Monitoring and click Enable batch monitoring:
Enable batch monitoring for an existing deployment
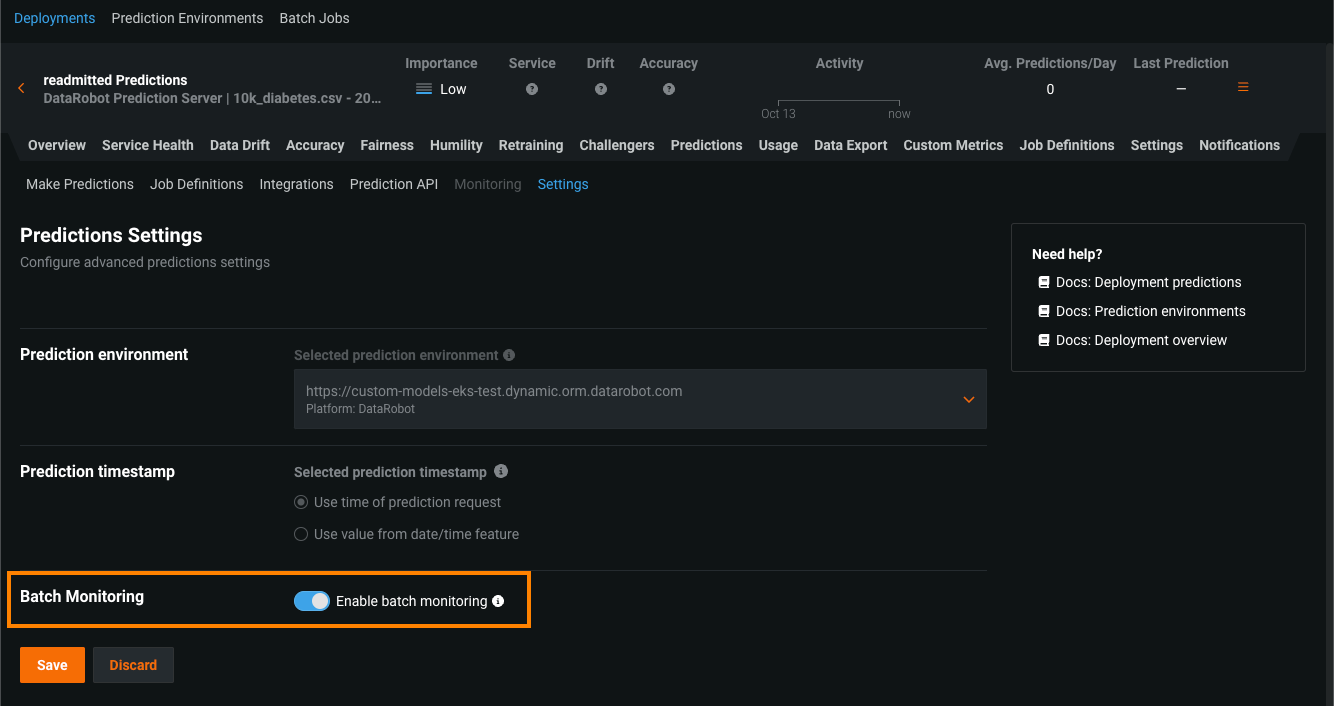
If you already created the deployment you want to configure for batch monitoring, navigate to that deployment's Predictions > Settings tab. Then, under Predictions Settings and Batch Monitoring, click Enable batch monitoring and Save the new settings:
View a batch monitoring deployment in the inventory
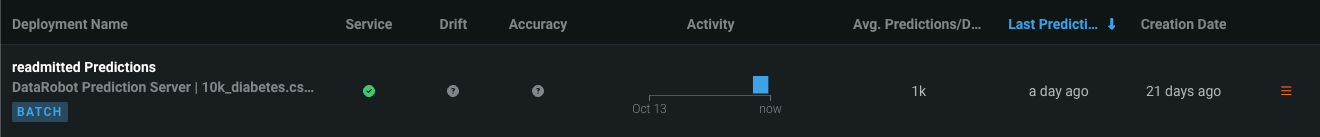
When a deployment has batch monitoring enabled, on the Deployments tab, in the Deployment Name column, you can see a BATCH badge. For these deployments, in the Prediction Health lens, the Service, Drift, and Accuracy indicators are based on the last few batches of predictions, instead of the last few days of predictions. The Activity chart shows any batch predictions made with the deployment over the last seven days:
To configure the number of batches represented by the Prediction Health indicators, you select a batch range on the deployment's settings tabs for Service Health, Data Drift, and Accuracy:
On the Service Health > Settings tab, in the Definition section, select the Range of prediction batches to include in the deployment inventory's Service indicator and click Save:
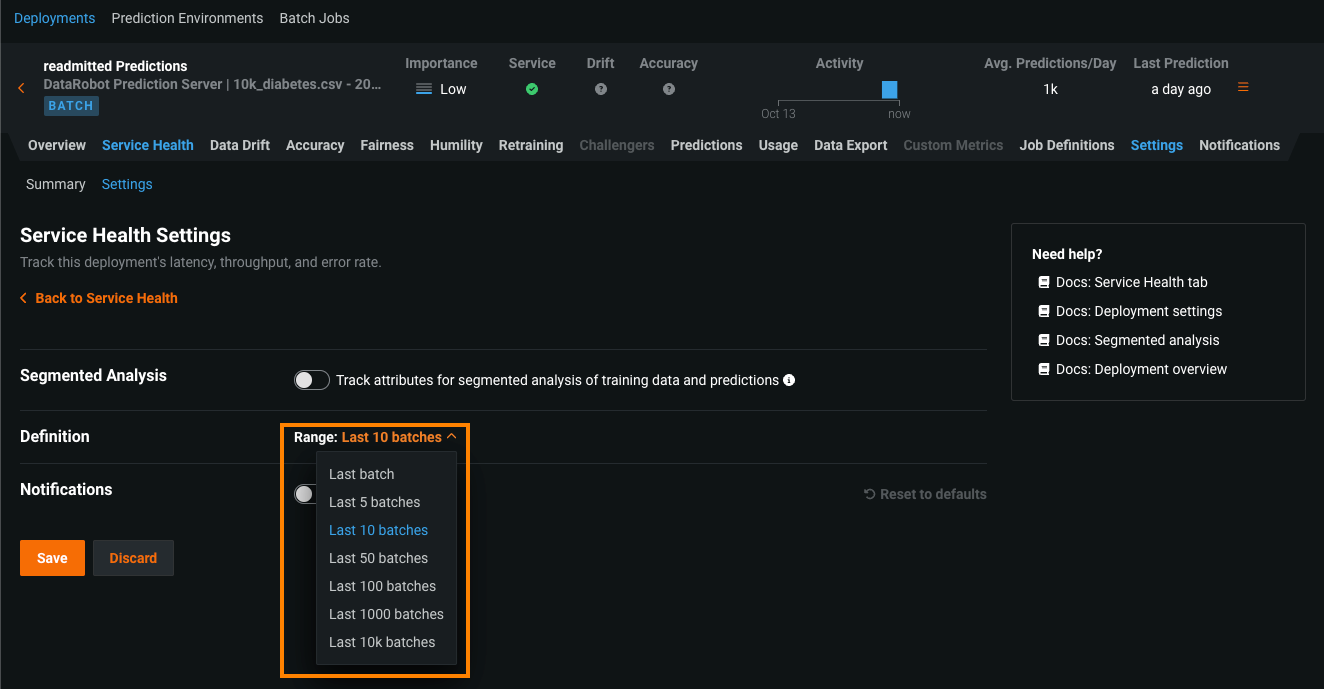
For more information on these settings, see the Set up service health monitoring documentation.
On the Data Drift > Settings tab, in the Definition section, select the Range of prediction batches to include in the deployment inventory's Drift indicator and click Save:
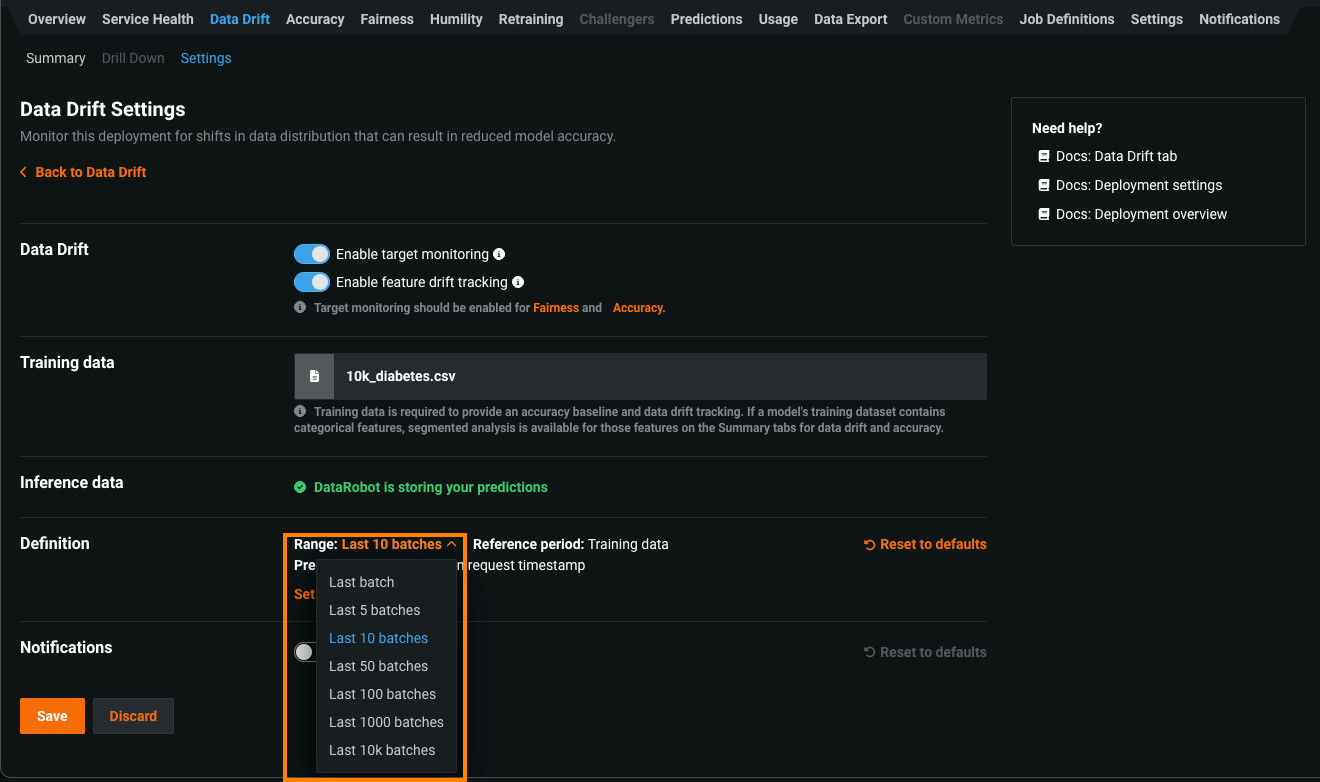
For more information on these settings, see the Set up data drift monitoring documentation.
On the Accuracy > Settings tab, in the Definition section, select the Range of prediction batches to include in the deployment inventory's Accuracy indicator and click Save:
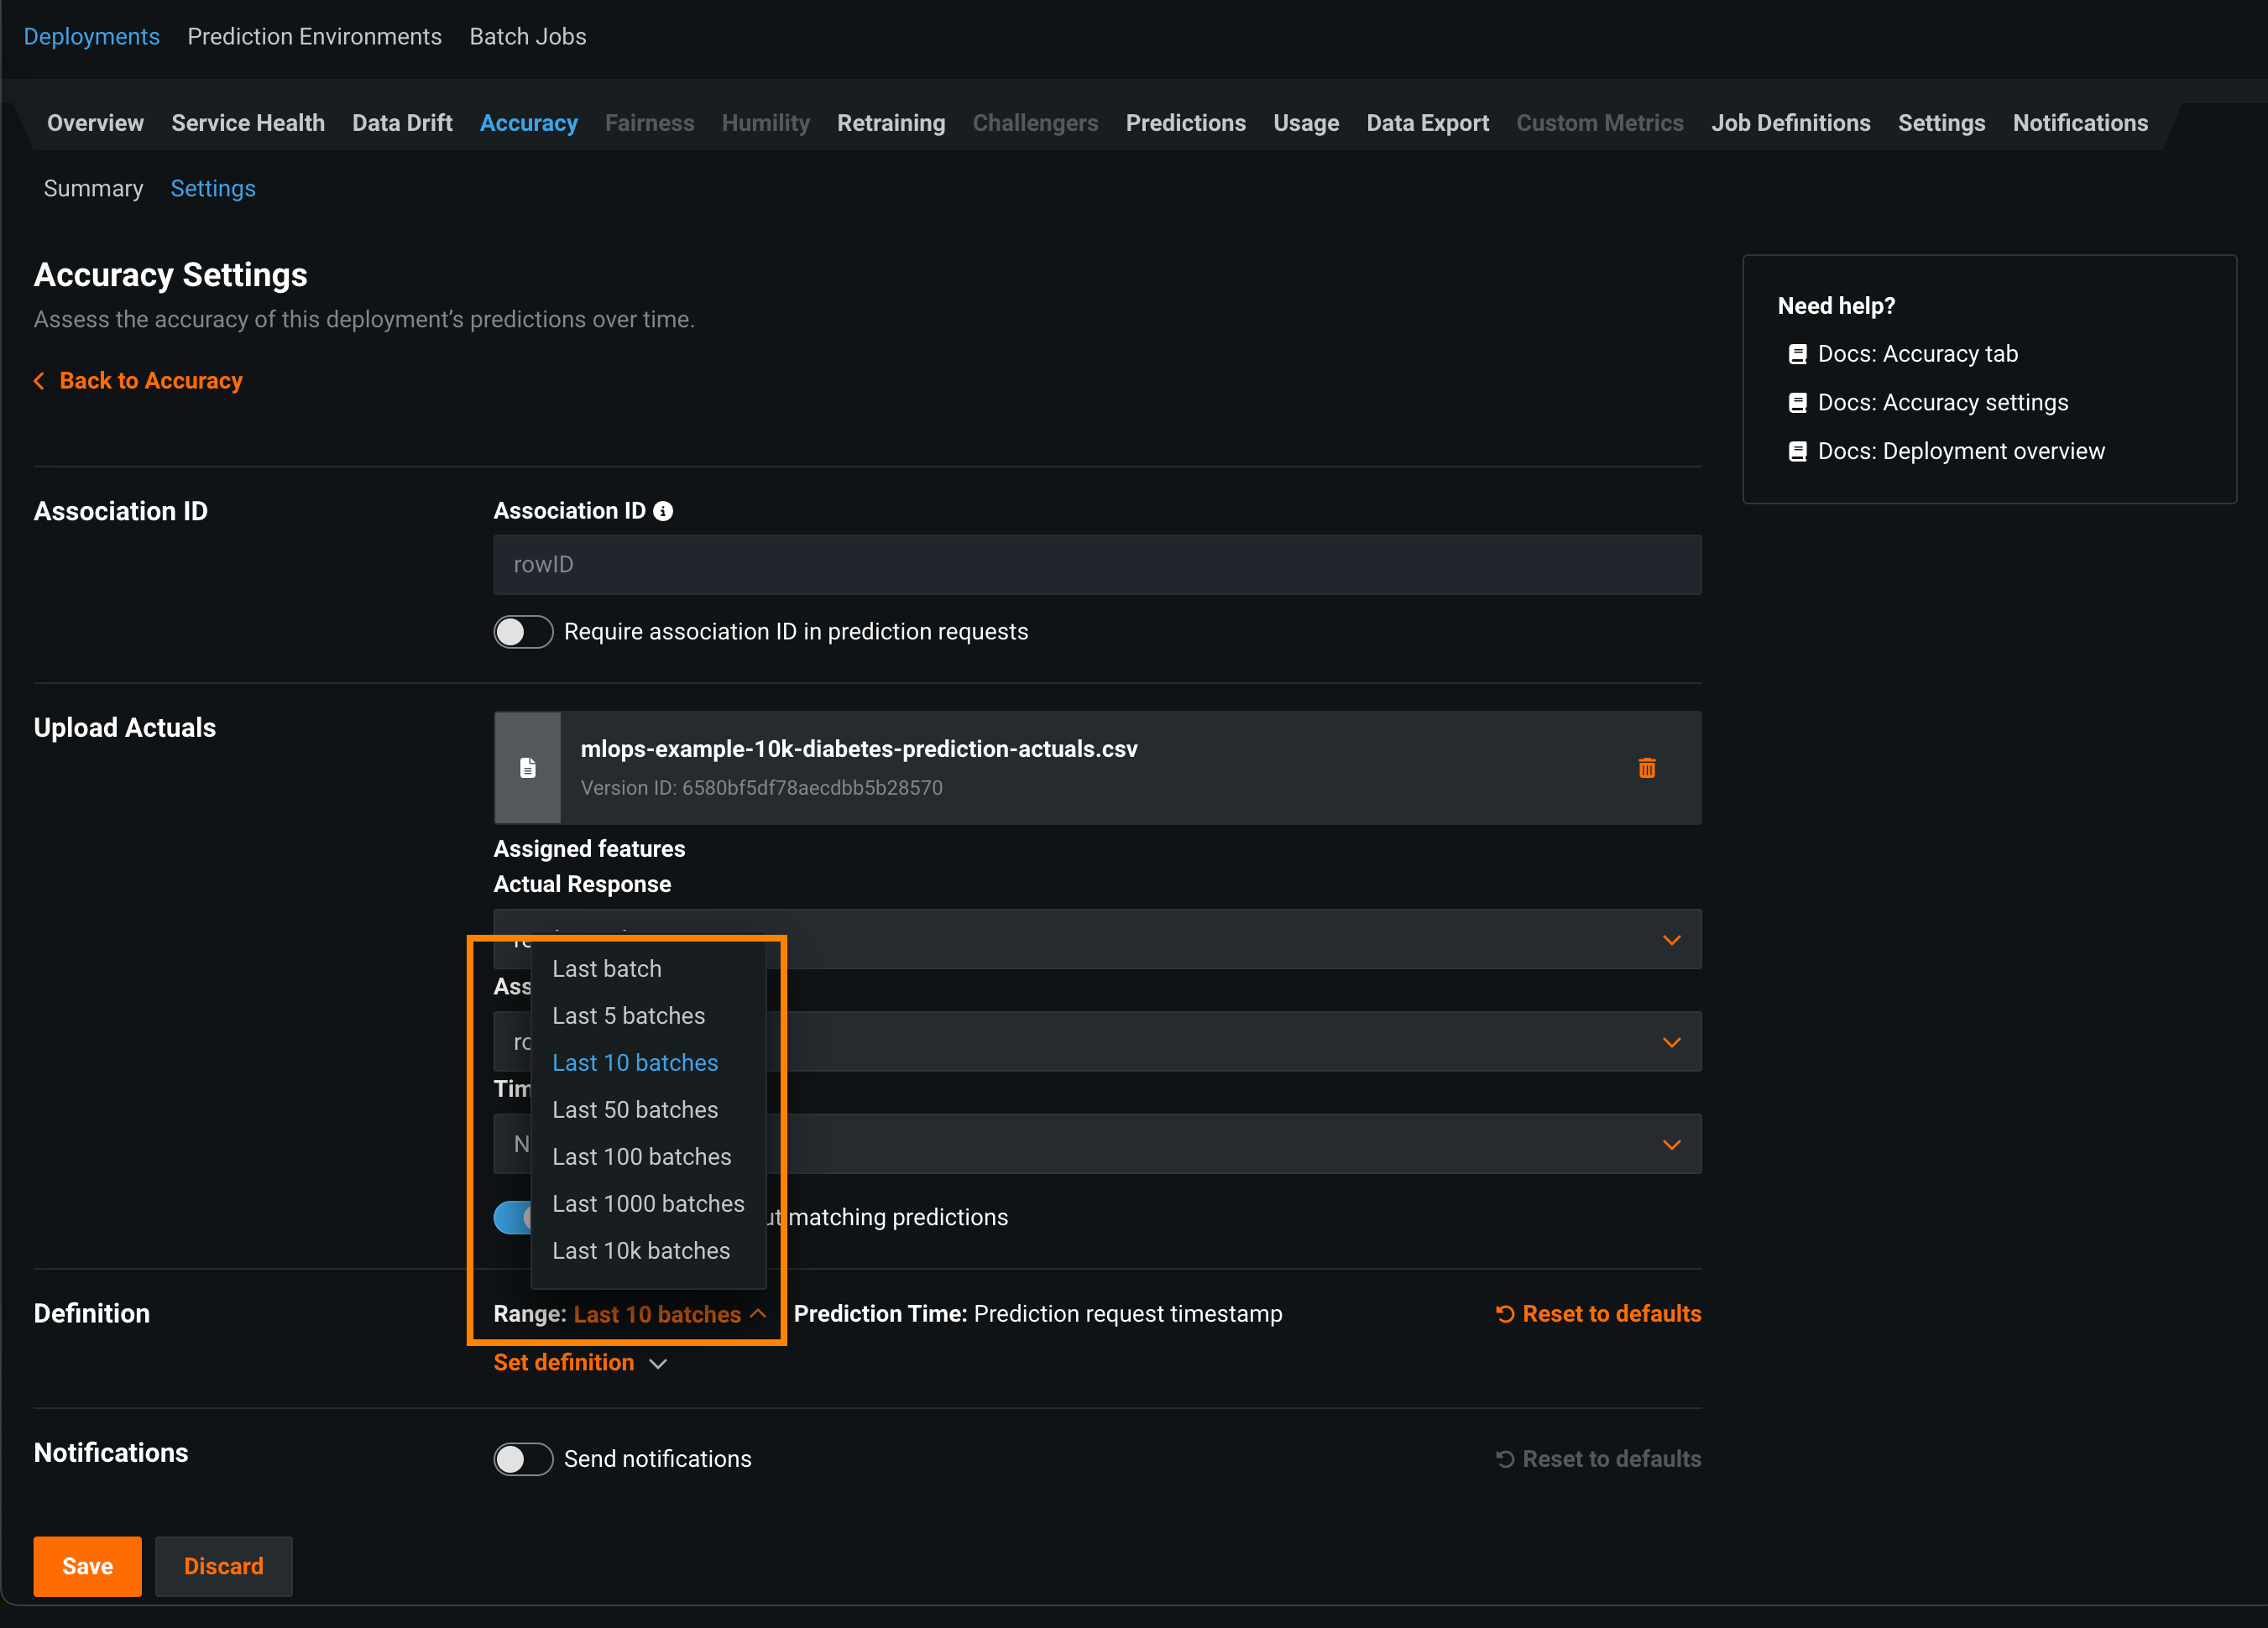
To configure accuracy monitoring, you must:
-
Add actuals in the Accuracy Settings.
Create batches with batch predictions
To make a batch and add predictions to it, you can make batch predictions or schedule a batch prediction job for your deployment. Each time a batch prediction or scheduled batch prediction job runs, a batch is created automatically, and every prediction from the batch prediction job is added to that batch.
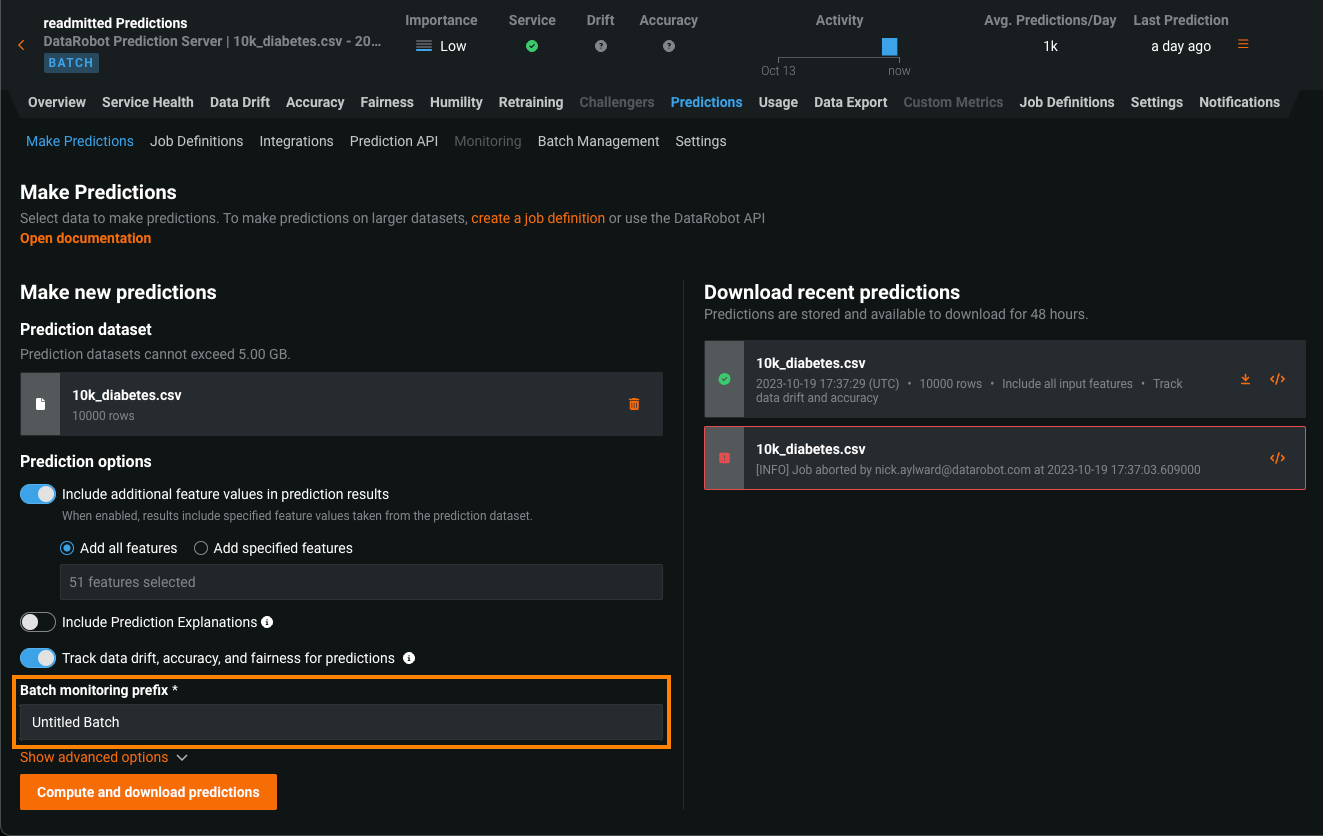
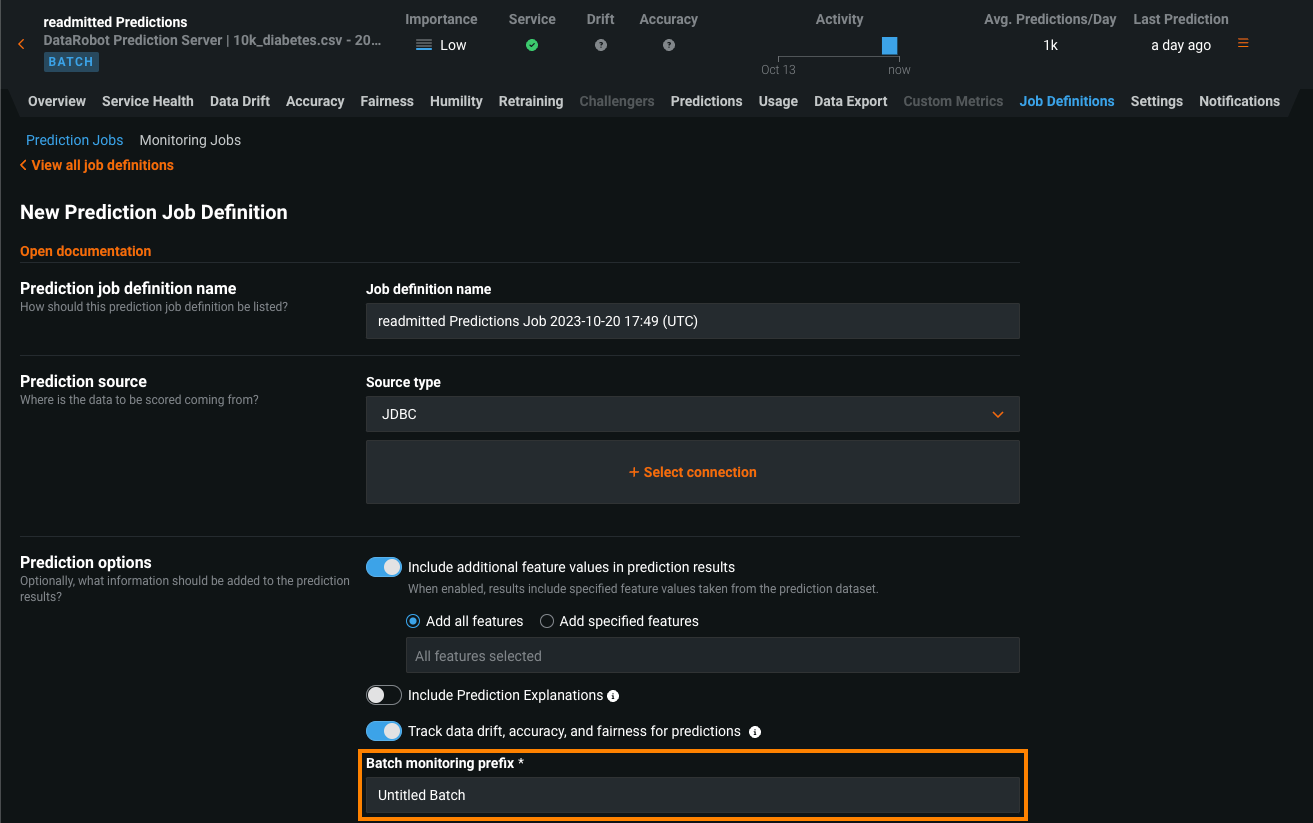
On the Predictions > Make Predictions tab, you can make one-time batch predictions as you would for a standard deployment; however, for batch deployments, you can also configure the Batch monitoring prefix to append to the prediction date and time in the Batch Name on the Batch Management tab:
On the Predictions > Prediction Jobs tab, you can click + Add job definition to create a recurring batch prediction job as you would for a standard deployment; however, for batch deployments, you can also configure the Batch monitoring prefix to append to the prediction date and time in the Batch Name on the Batch Management tab:
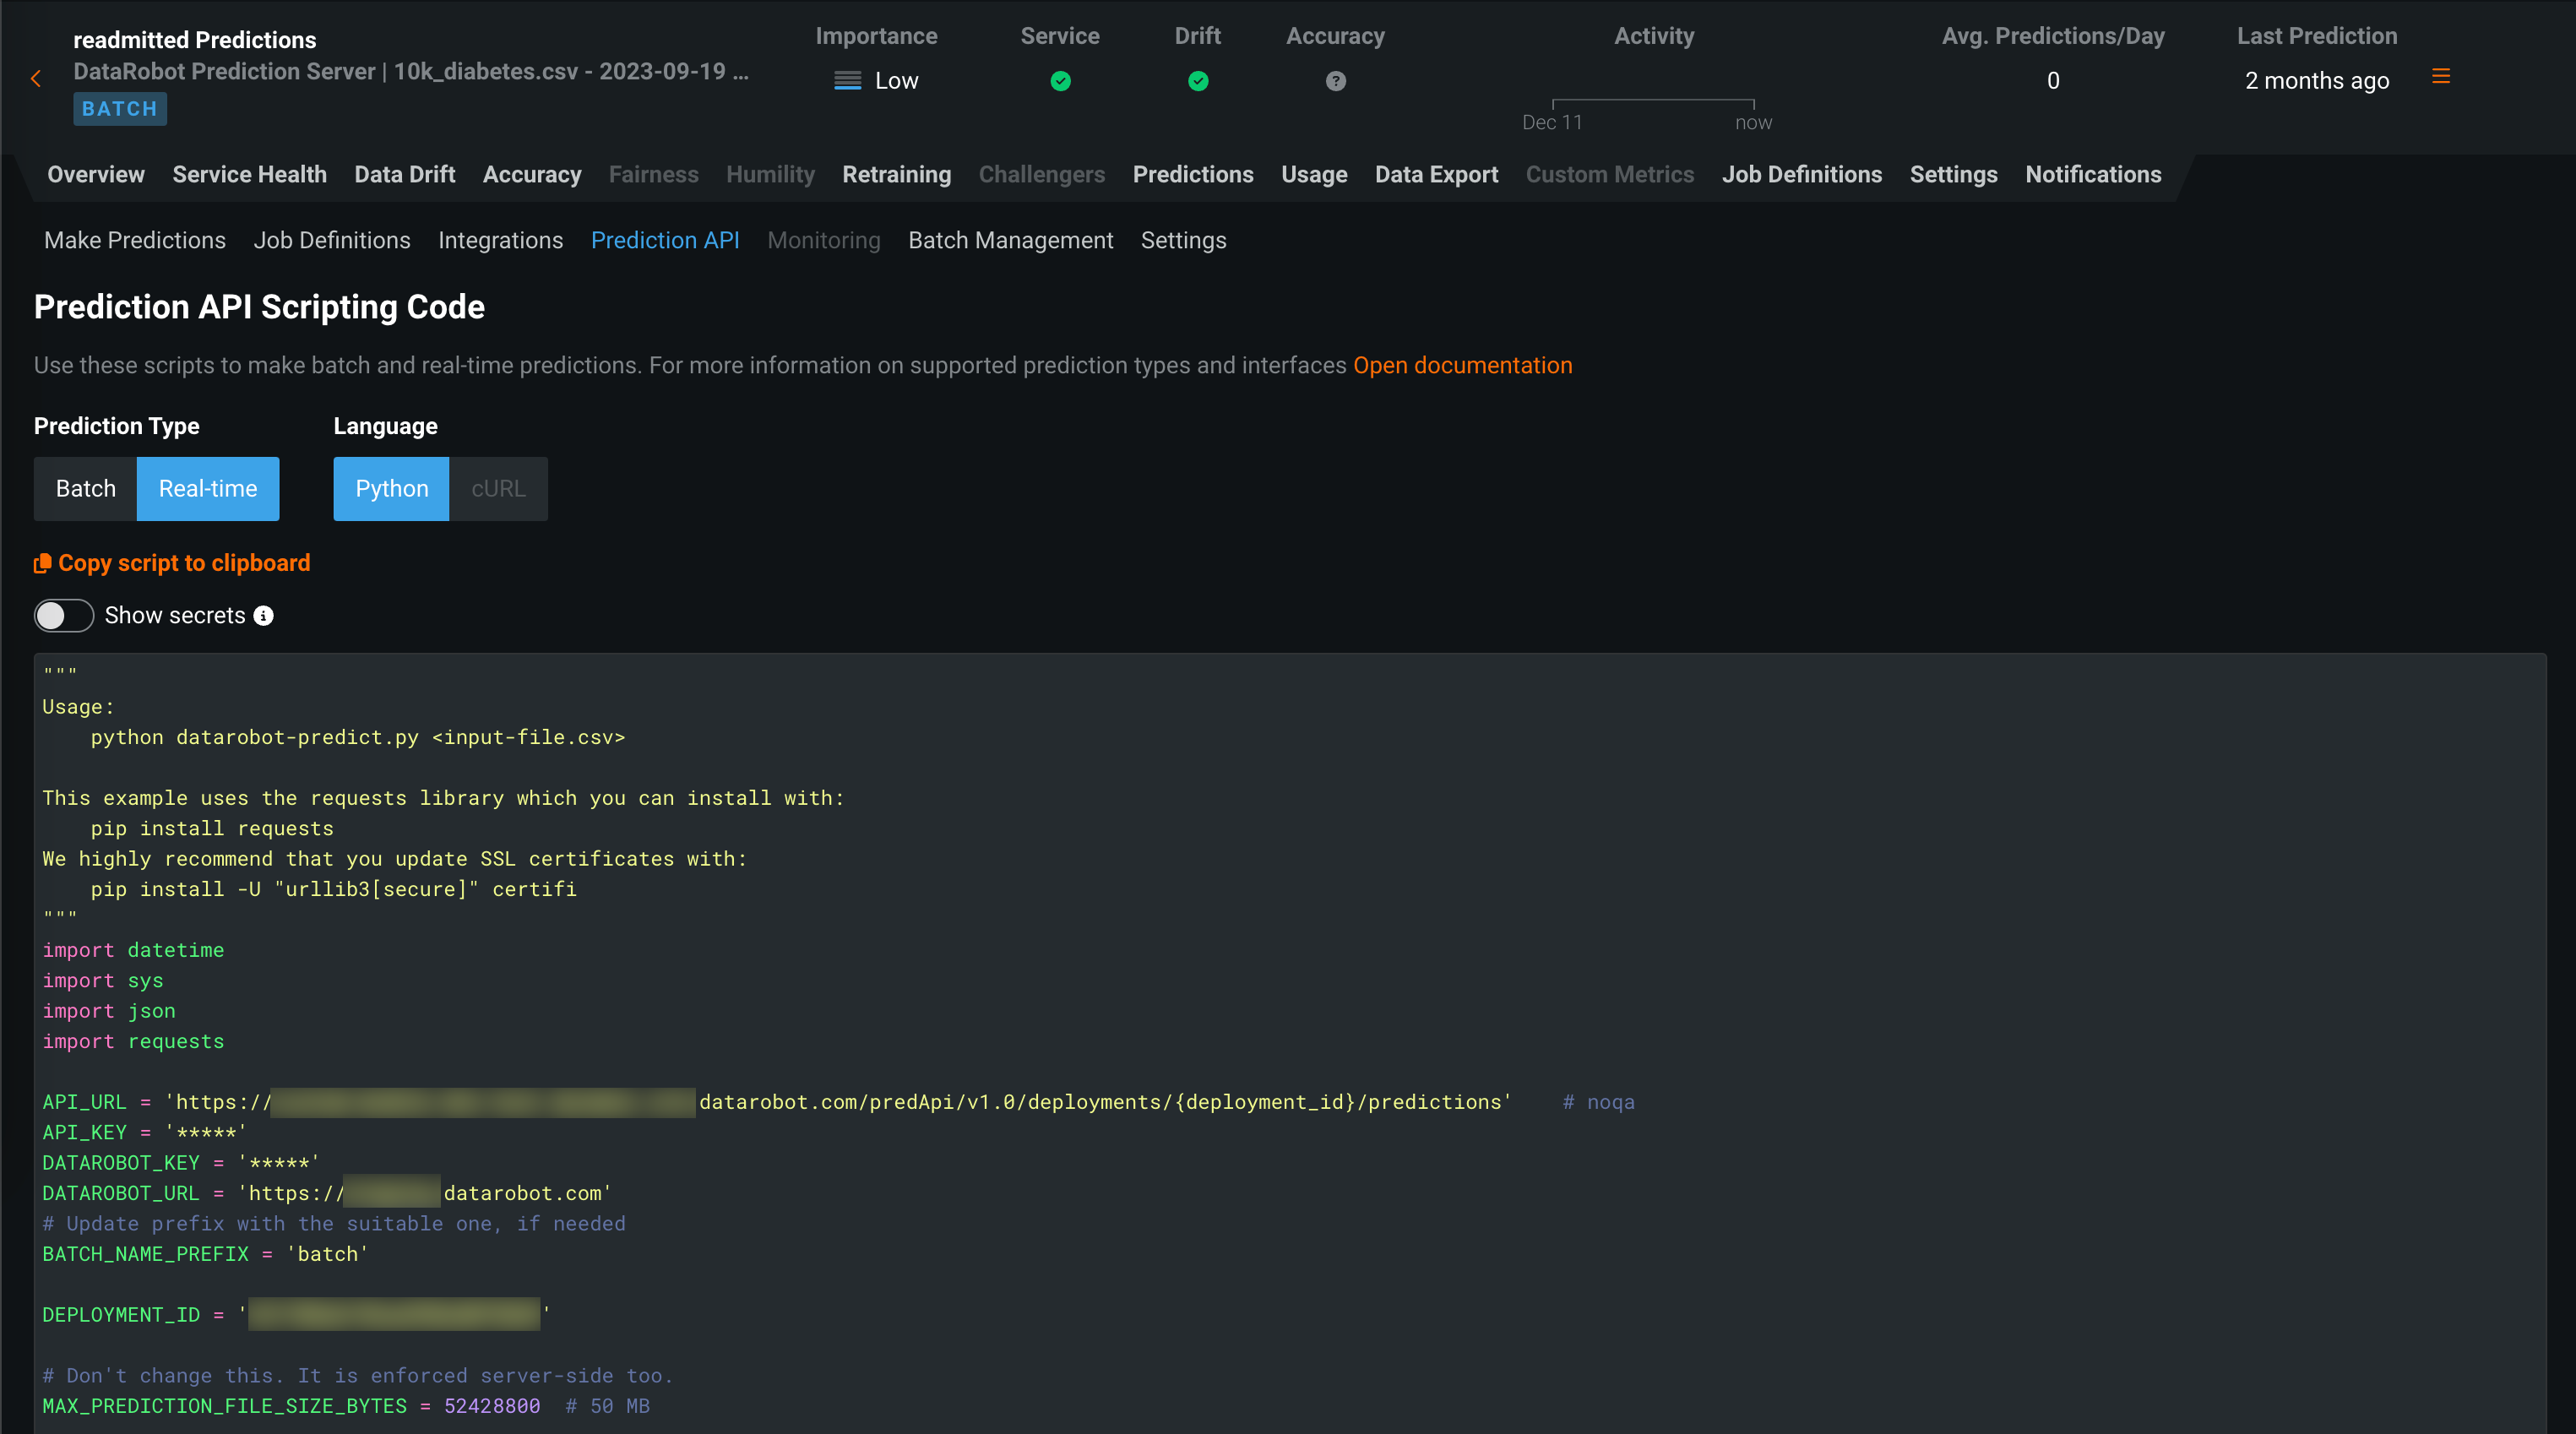
In addition, on the Predictions > Predictions API tab, you can copy and run the Python code snippet to make a DataRobot API request creating a batch on the Batch Management tab and adding predictions to it:
Create a batch and add agent-monitored predictions
In a deployment with the BATCH badge, you can access the Predictions > Batch Management tab, where you can add batches. Once you have the Batch ID, you can assign predictions to that batch. You can create batches using the UI or API:
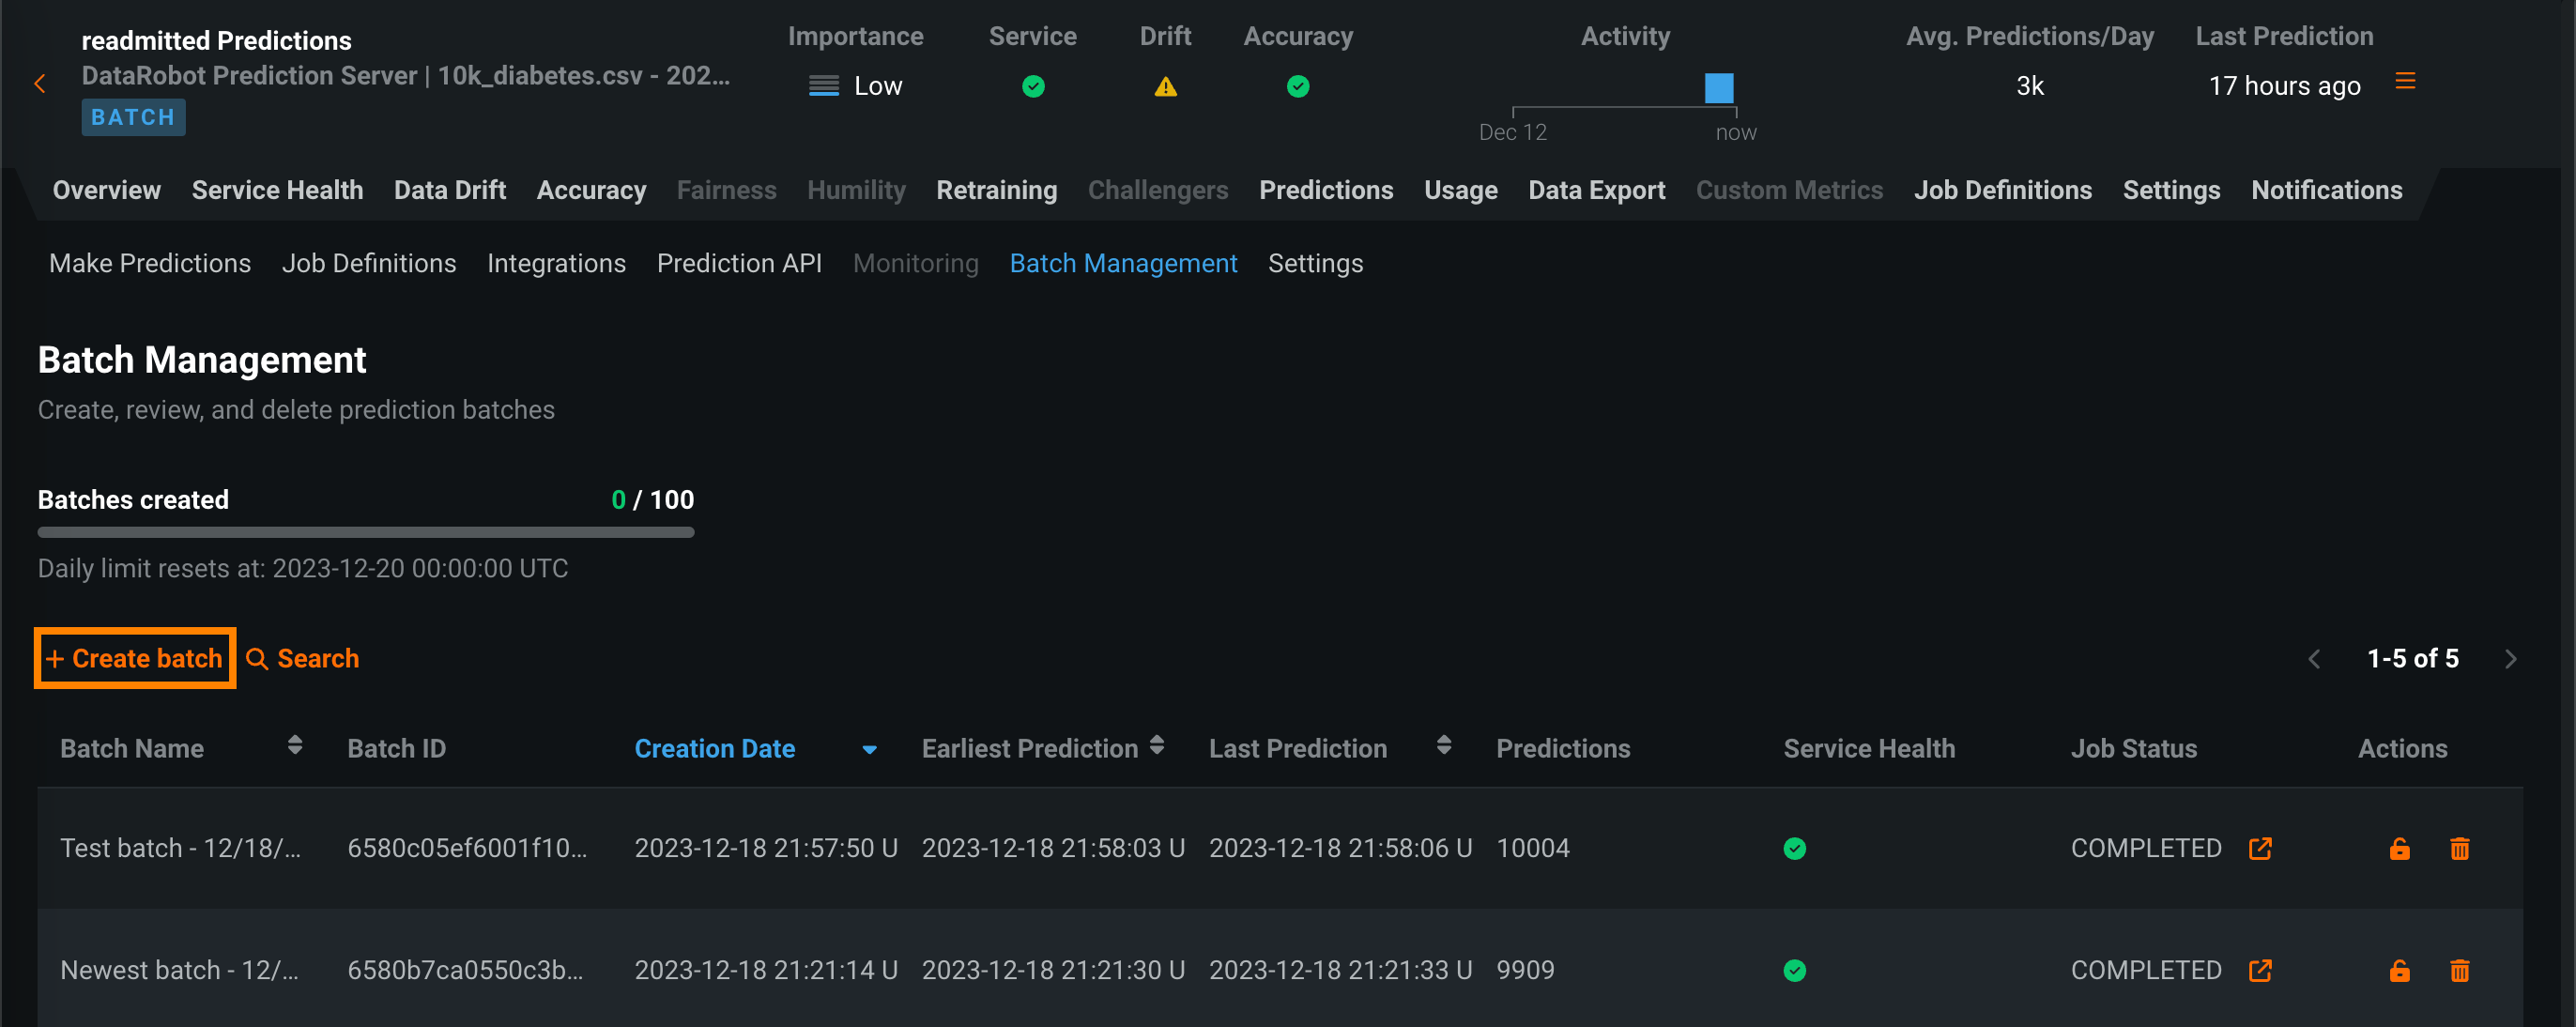
On the Predictions > Batch Management tab, click + Create batch, enter a Batch name, and then click Submit:
The following Python script makes a DataRobot API request to create a batch on the Batch Management tab:
| create_batch.py | |
|---|---|
1 2 3 4 5 6 7 8 9 10 11 12 13 14 15 16 17 18 | |
Before running this script, define the API_KEY, DATAROBOT_KEY, BATCH_CREATE_URL, and batchName on the highlighted lines above. DataRobot recommends storing your secrets externally and importing them into the script.
You can now add predictions to the new batch. To add predictions from an agent-monitored external model to an existing batch, you can follow the batch monitoring example provided in the MLOps agent tarball. Before you run the example, on the Predictions > Batch Management tab, copy the Batch ID of the batch you want to add external predictions to, saving it for use as an input argument in the agent example.
In the BatchMonitoringExample/binary_classification.py example script included in the MLOps agent tarball, the batch ID you provide as an input argument defines the batch_id in the report_deployment_stats and report_predictions_data calls on the highlighted lines below:
| binary_classification.py | |
|---|---|
118 119 120 121 122 123 124 125 126 127 128 129 130 131 132 133 134 135 136 137 138 139 140 141 142 143 144 145 146 147 148 149 150 151 152 153 154 155 156 157 158 159 | |
Predictions reported by the agent are added to the batch you defined in the code.
Create batches with the batch CLI tools
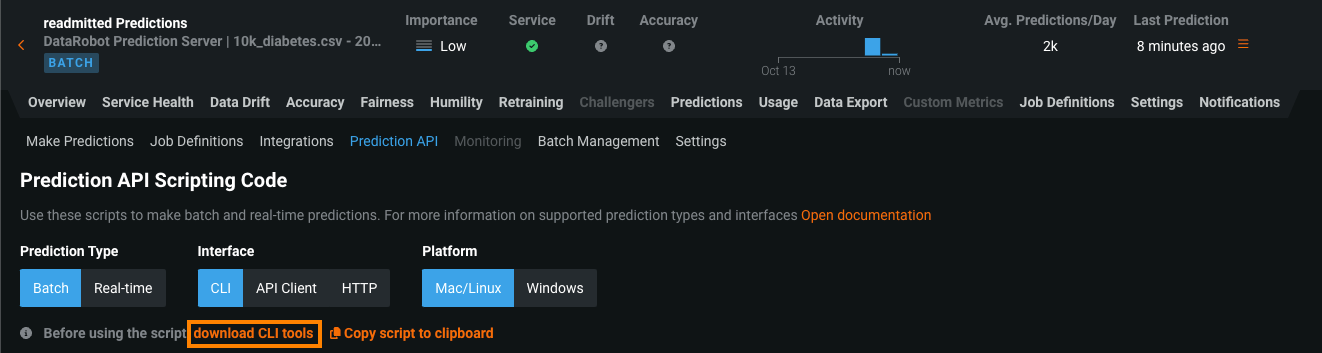
To make batch predictions using the DataRobot command line interface (CLI) for batch predictions, download the CLI tools from the Predictions > Prediction API tab of your deployment. To locate it make sure the Prediction Type is set to Batch and the Interface is set to CLI, then click download CLI tools (or Copy script to clipboard):
Open the downloaded predict.py file (or paste the code you copied into a Python file) and add the highlighted code below to the appropriate location in the file, defining monitoringBatchPrefix to assign a name to your batches:
| predict.py | |
|---|---|
408 409 410 411 412 413 414 415 416 417 418 419 420 421 | |
You can now use the CLI as normal, and the batch predictions are added to a batch with the batch prefix defined in this file.
Manage batches
On the Predictions > Batch Management tab, in addition to creating batches, you can perform a number of management actions, and view your progress towards the daily batch creation limit for the current deployment.
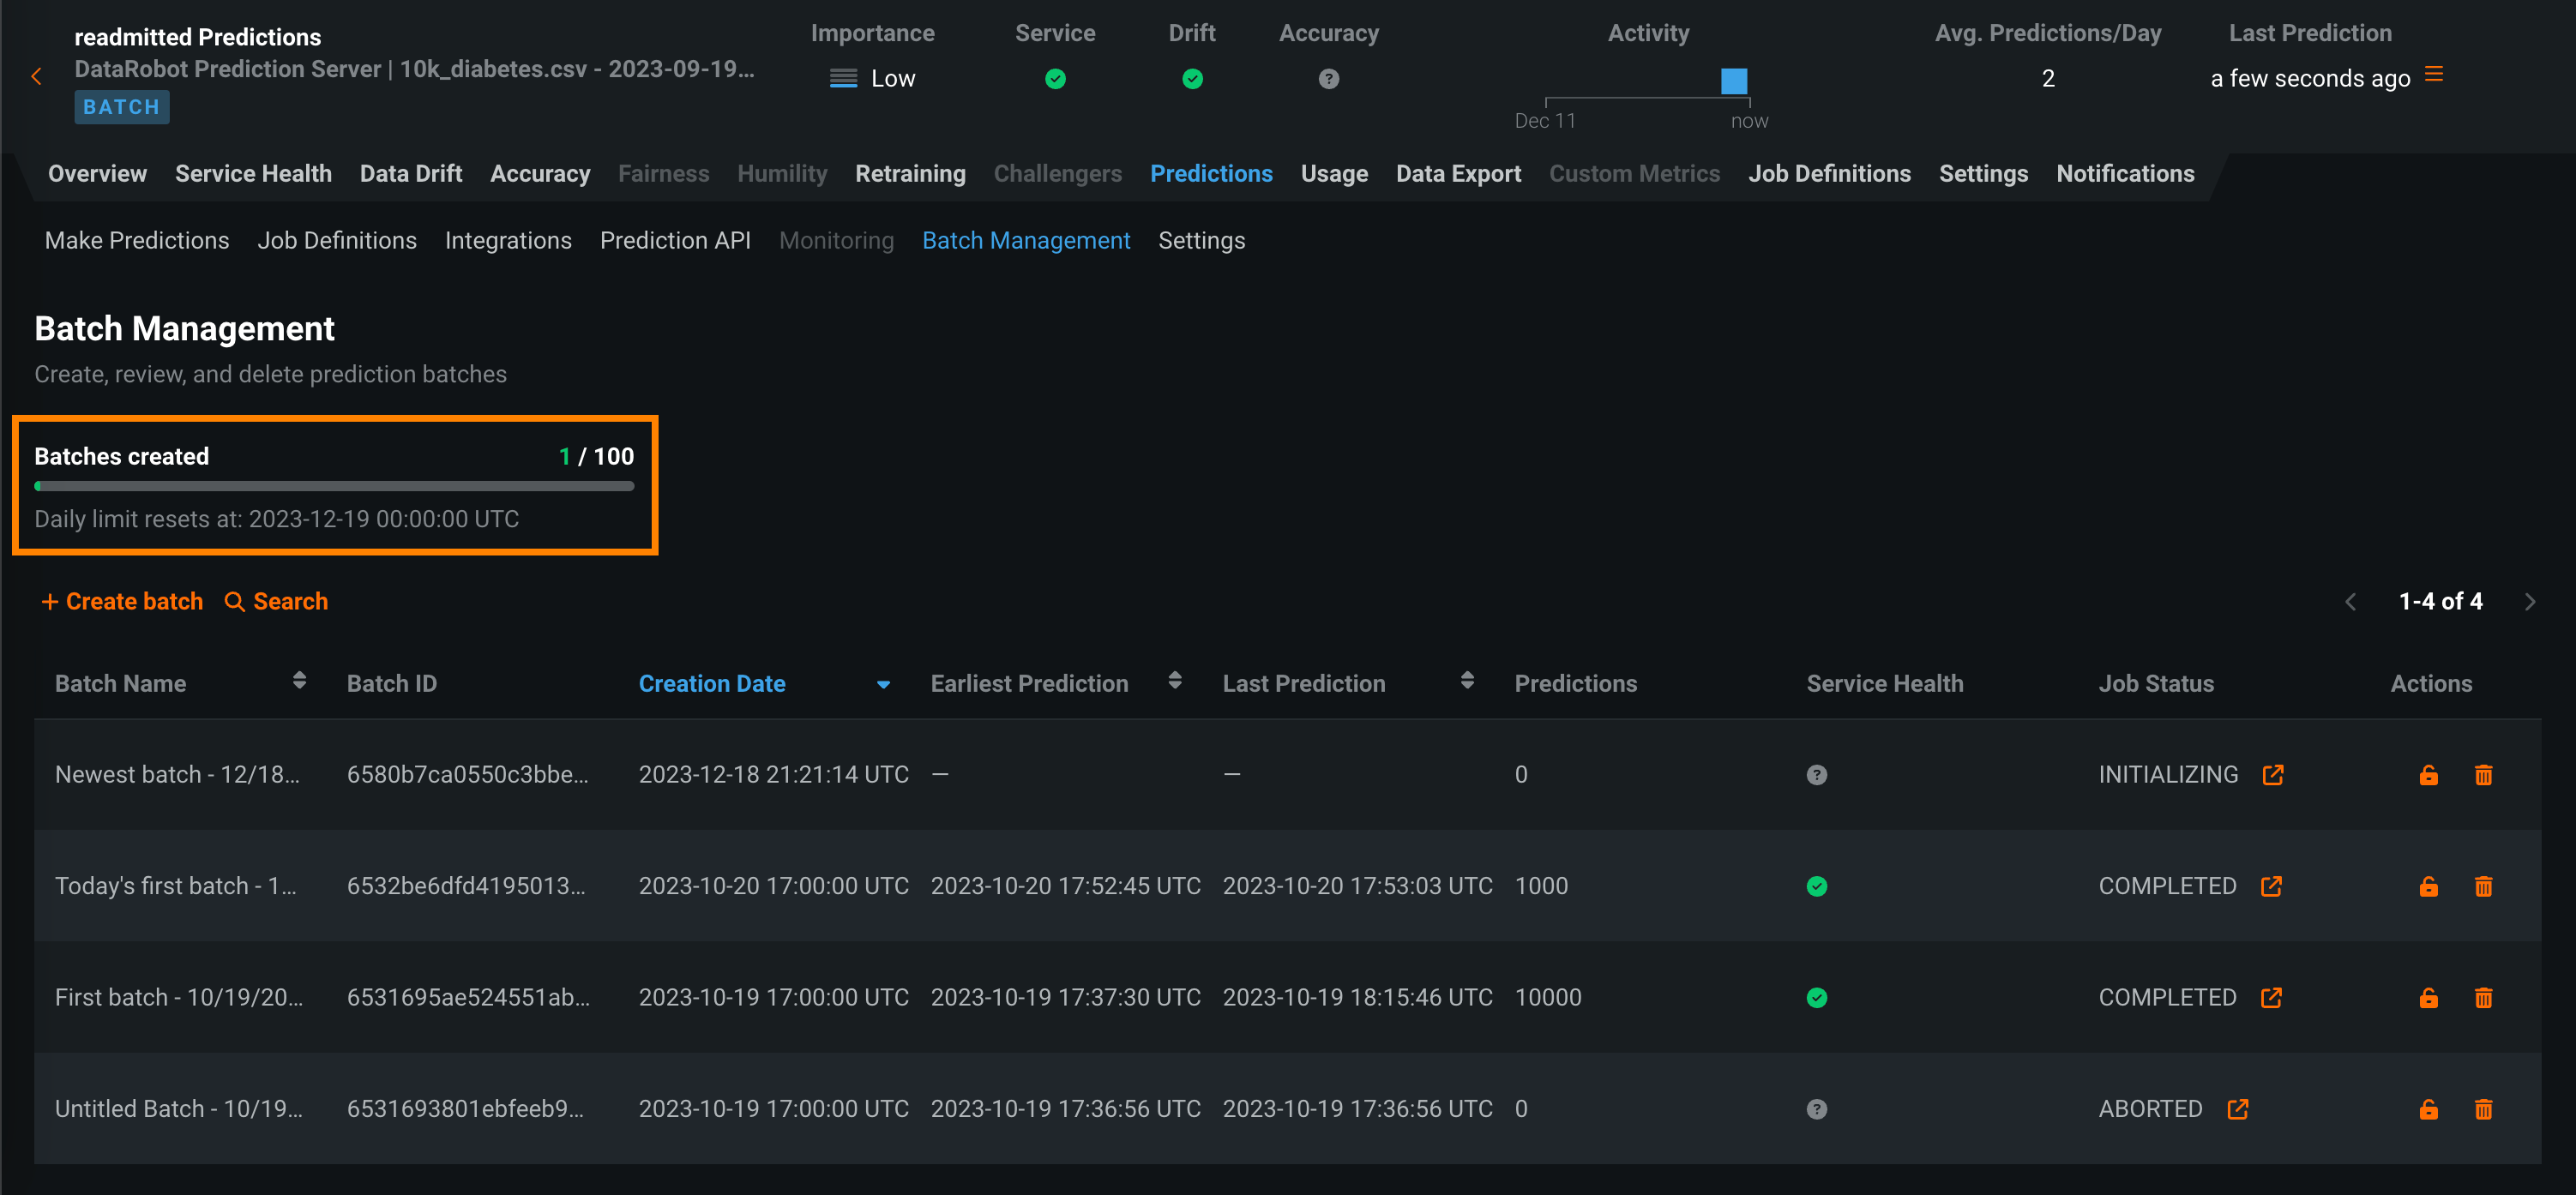
At the top of the Batch Management page, you can view the Batches created progress bar. The default batch creation limit is 100 batches per deployment per day. Below the progress bar, you can view the when your daily limit resets:
Note
While the default is 100 batches per deployment per day, your limit may vary depending on your organization's settings. For Self-managed AI Platform installations, this limit does not apply unless specifically set by your organization's administrator.
Tip
You can also view your progress toward the Batches created limit on the Usage tab.
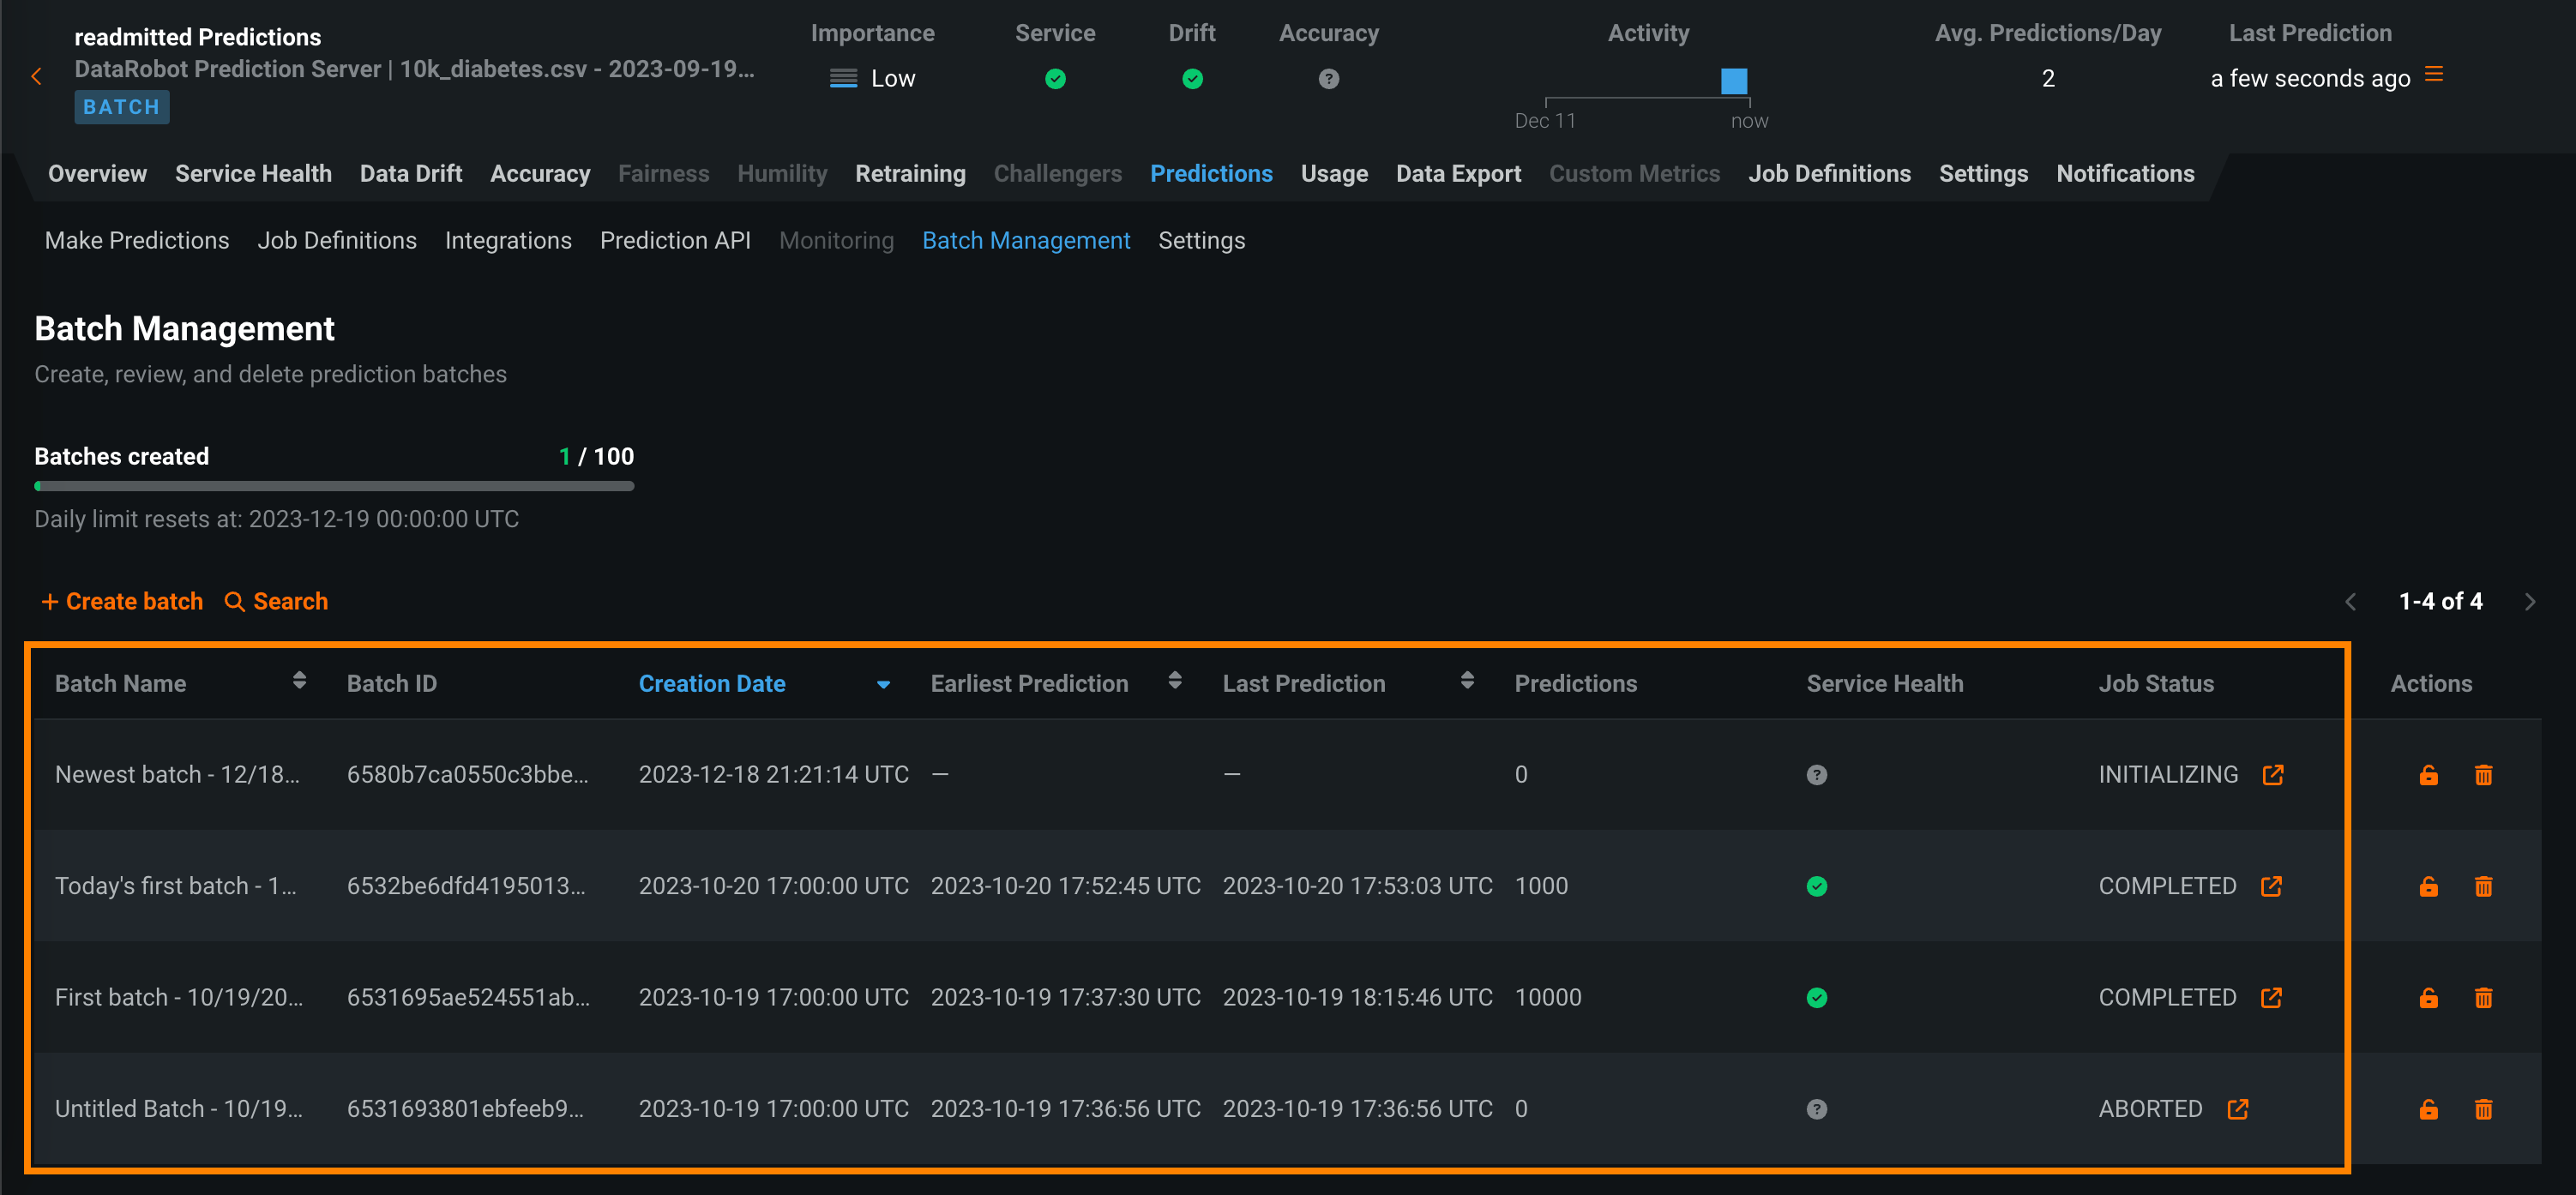
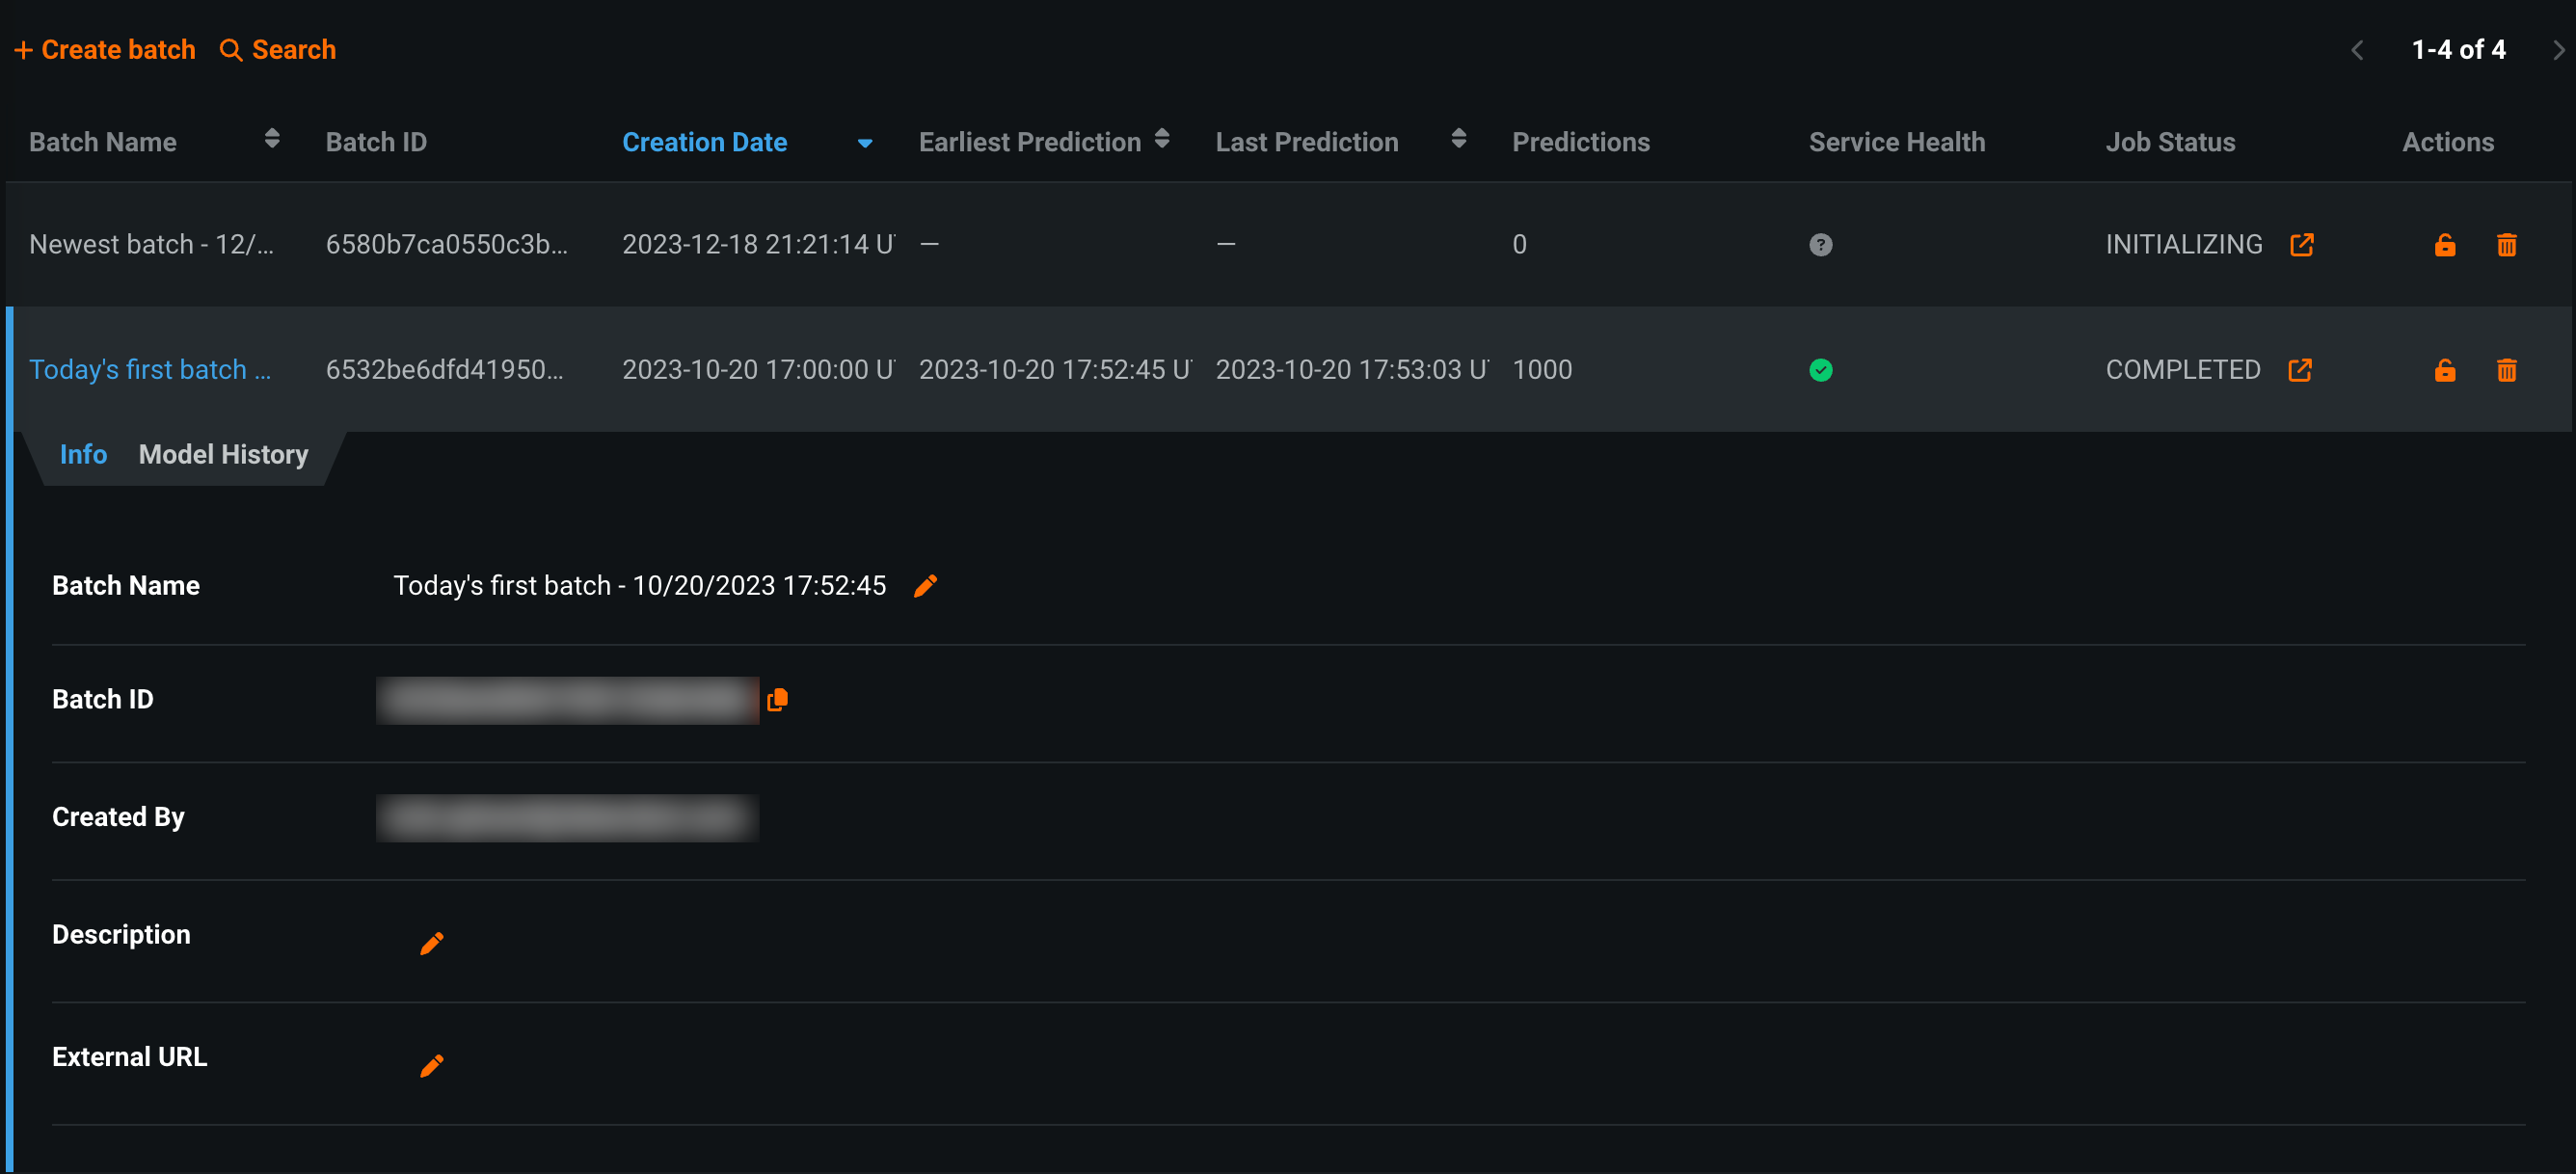
In the list below, you can view basic batch information, including the Batch Name, Batch ID, Creation Date, Earliest Prediction, Latest Prediction, and the number of Predictions.
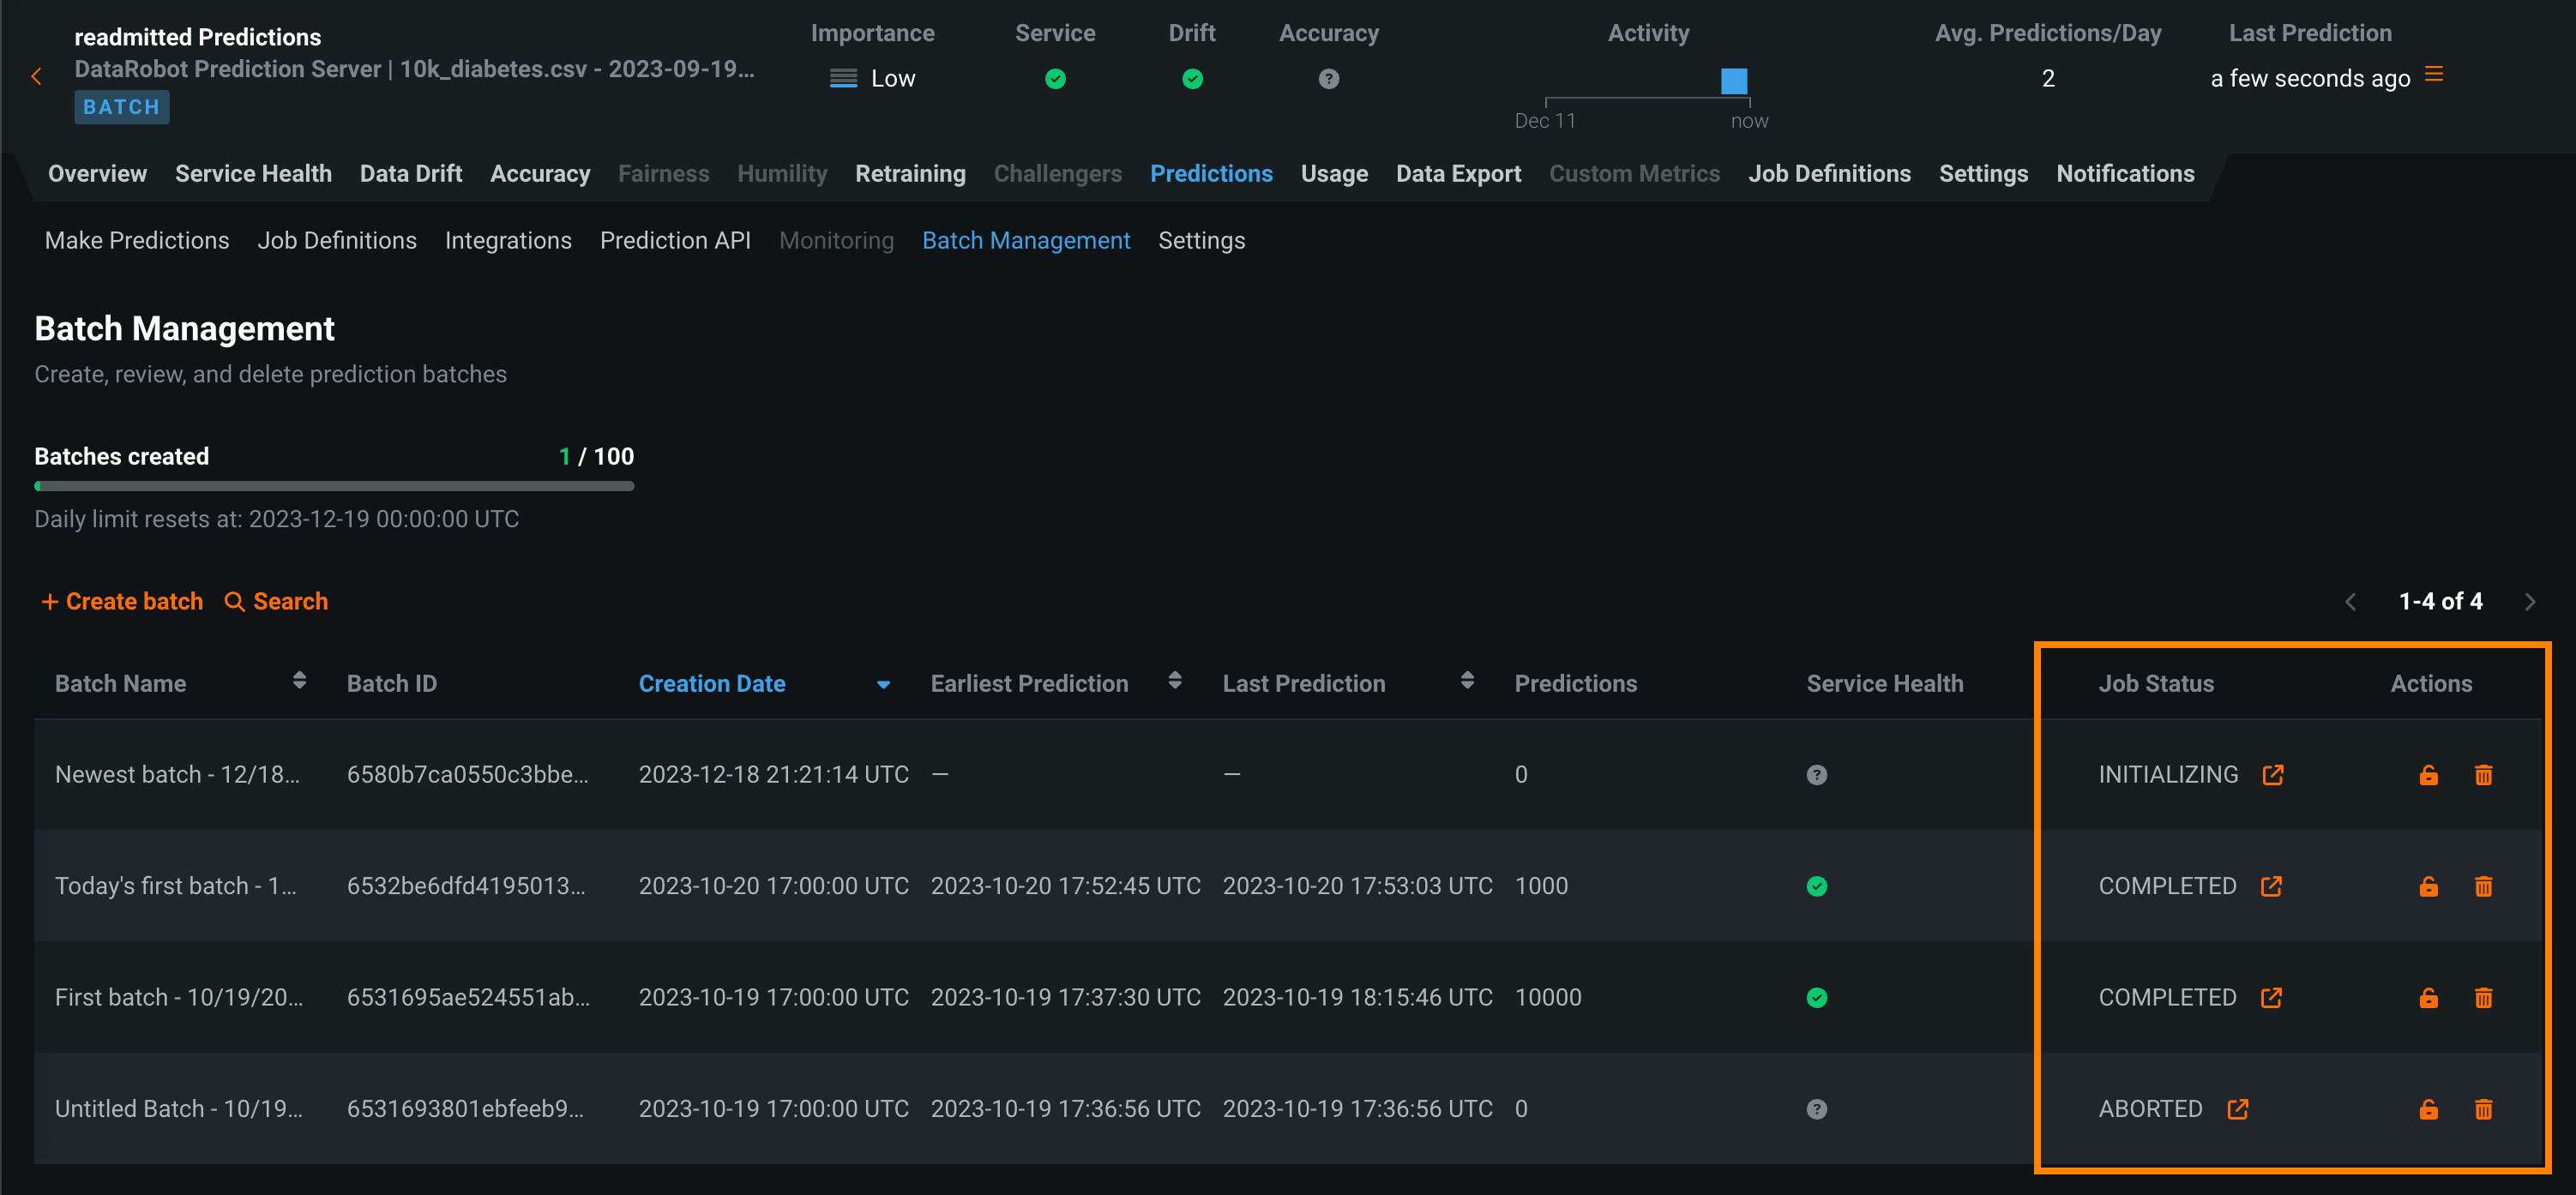
Additionally, you can view advanced information, such as:
| Row | Description |
|---|---|
| Service Health | Indicates if there are any predictions with 400 or 500 errors in this batch. |
| Job Status | For batches associated with a batch prediction job, indicates the current status of the batch prediction job that created this batch. |
In the Job Status and Actions columns, you can perform several management actions:
| Action | Description |
|---|---|
| For batches associated with a batch prediction job, opens the the Deployments > Batch Jobs tab to view the prediction job associated with that batch. | |
| Lock the batch to prevent the addition of new predictions. | |
| Delete the batch to remove faulty predictions. |
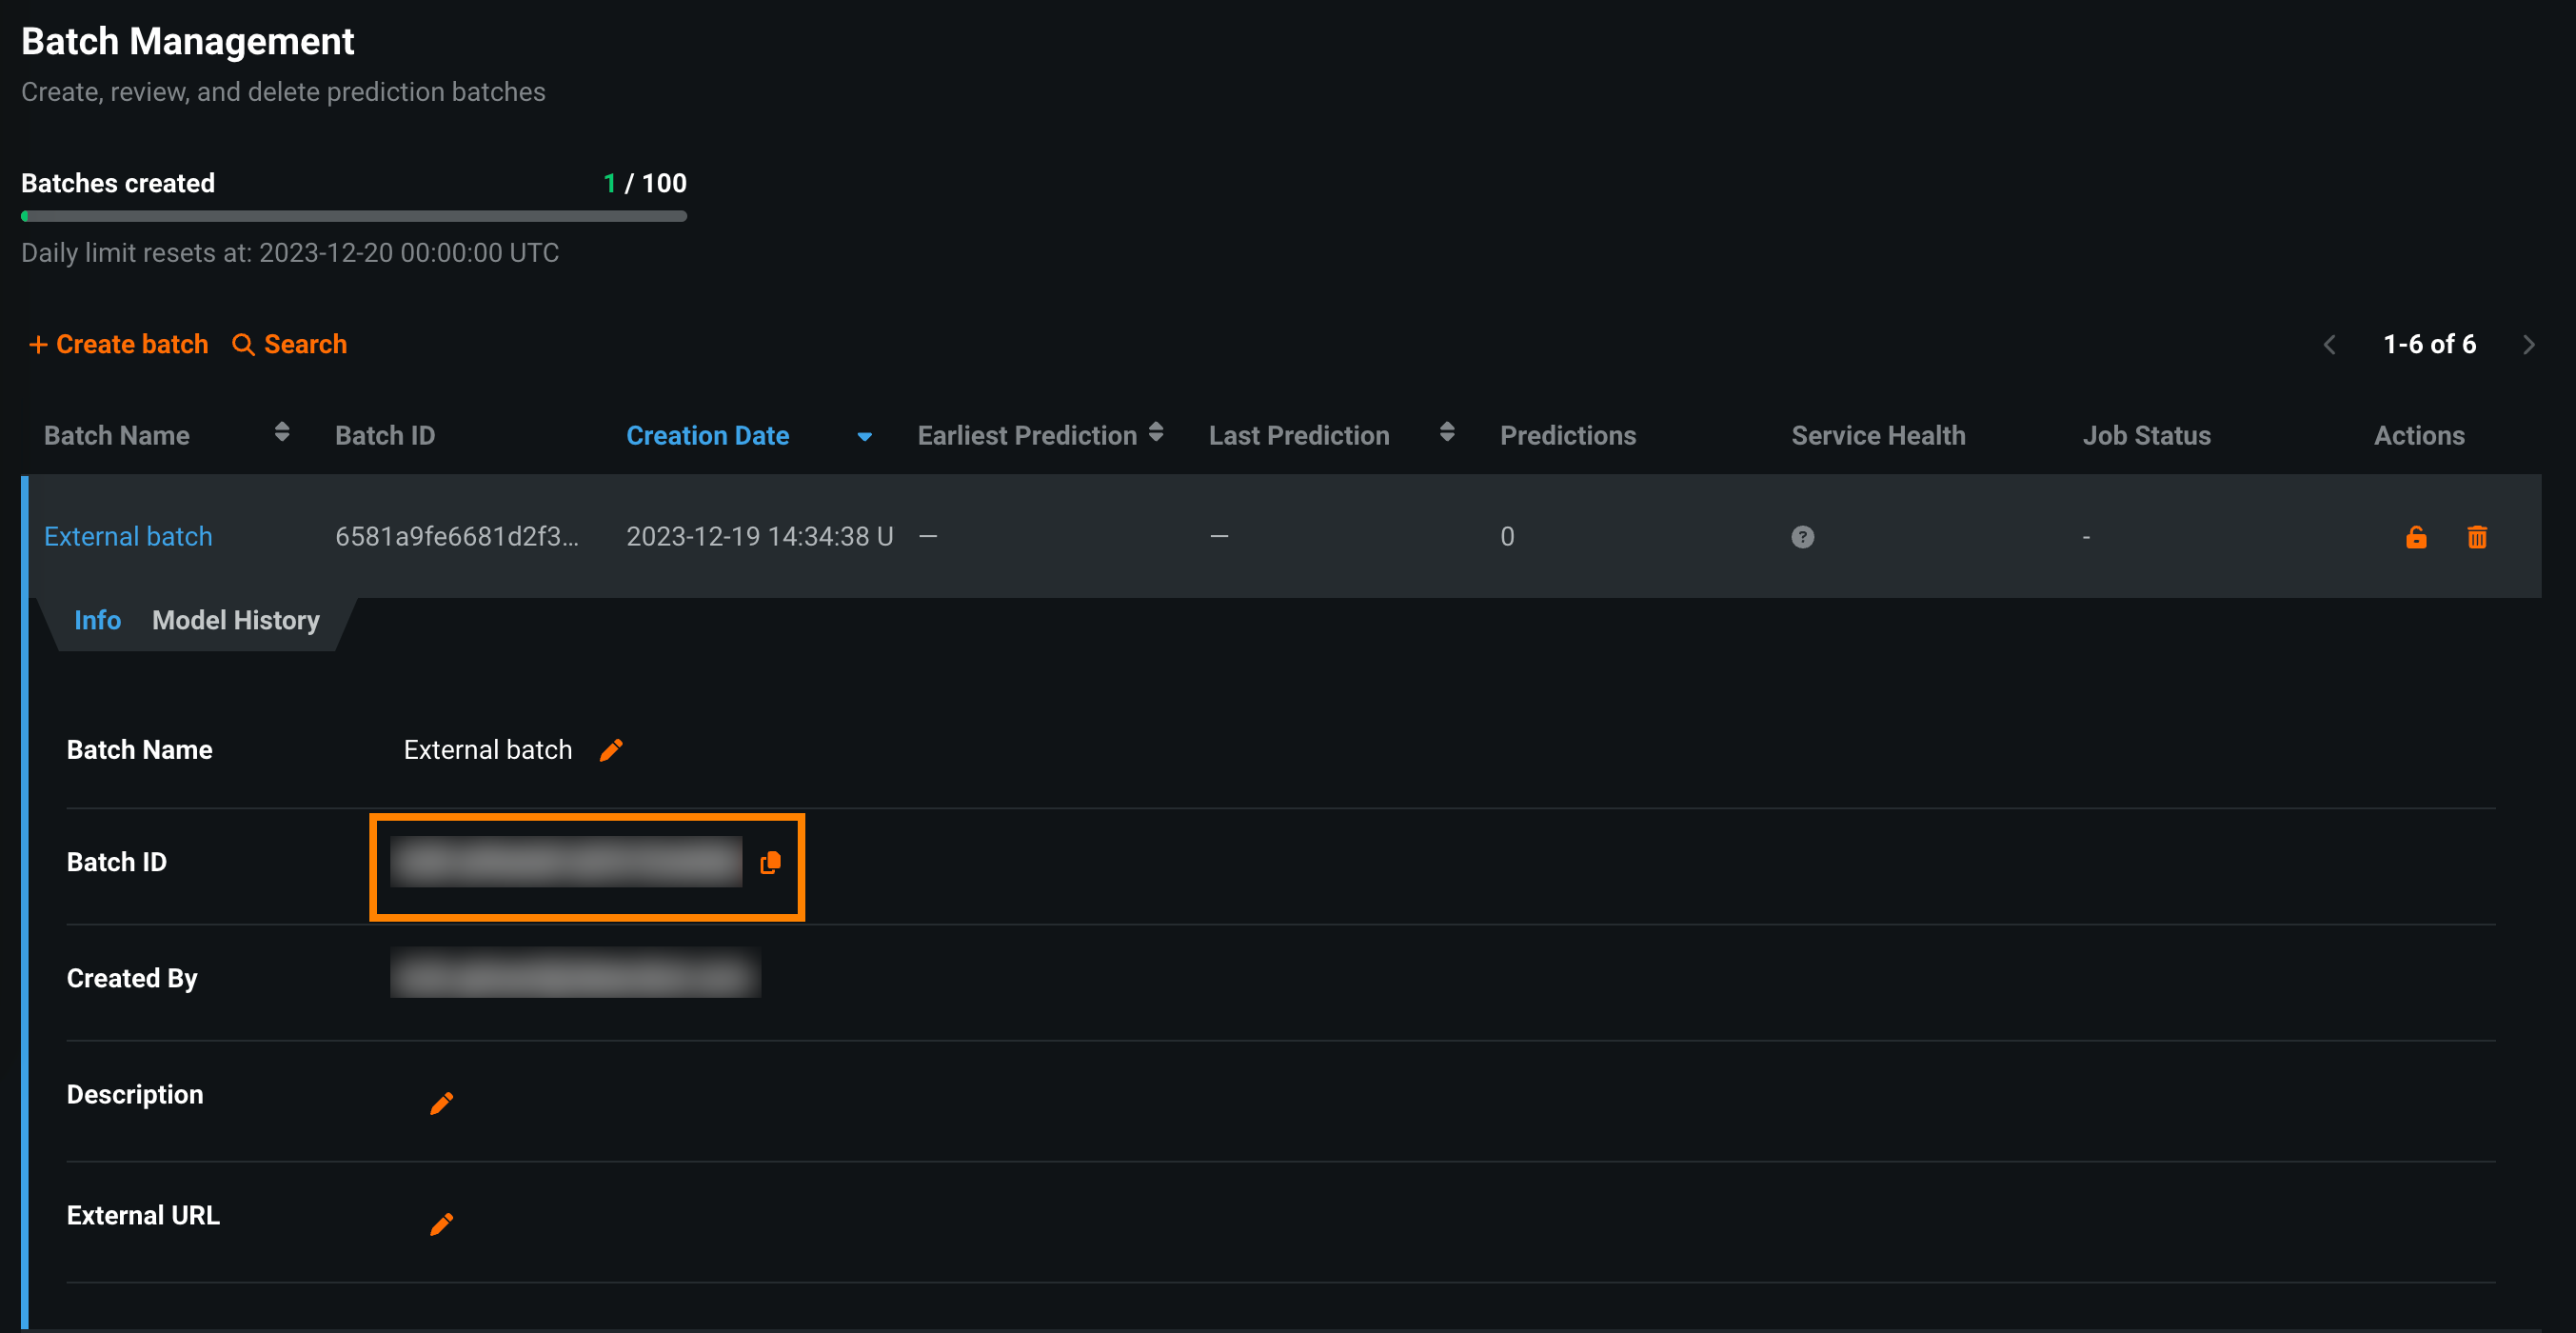
Click a batch to open the Info tab, where you can view and edit () the Batch Name, Description, and External URL. In addition, you can click the copy icon () next to the Batch ID to copy the ID for use in prediction code snippets:
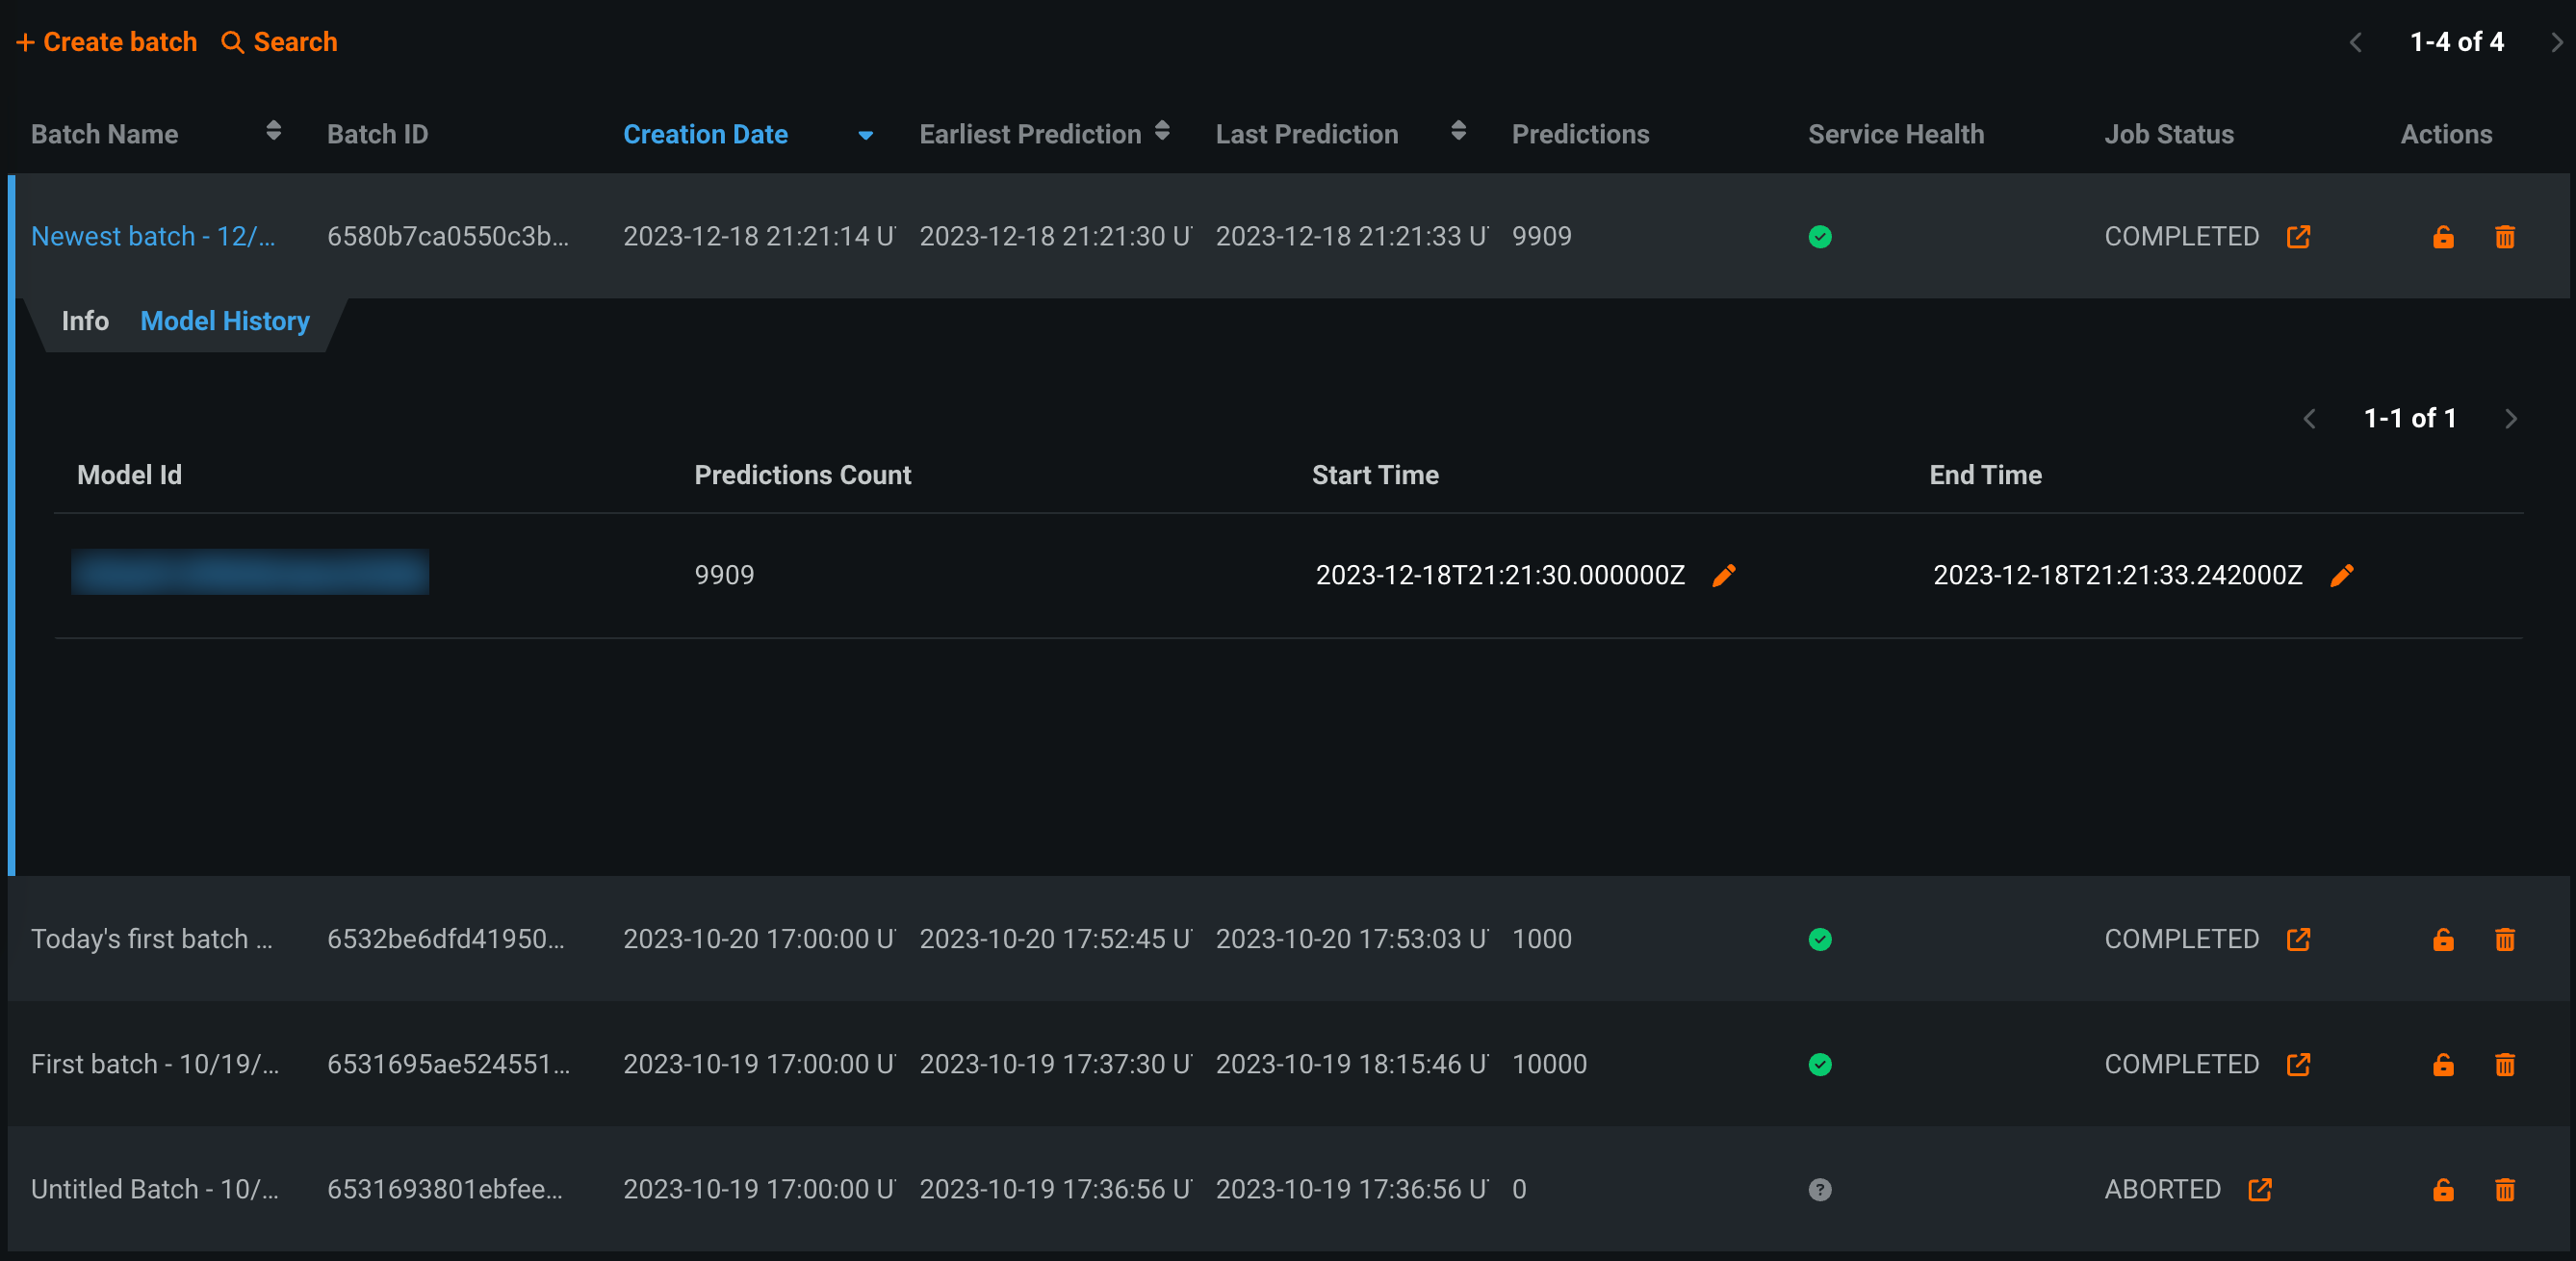
Click the Model History tab to view the Model Id of any model used to make predictions for a batch. You can also view the prediction Start Time and End Time fields. You can edit () these dates to identify predictions made on historical data, allowing the deployments charts to display prediction information for when the historical data is from, instead of displaying when DataRobot received the predictions:
Monitoring for batch deployments
Batch deployments support batch-specific service health, data drift, and accuracy monitoring. These visualizations differ from the visualizations for standard deployments:
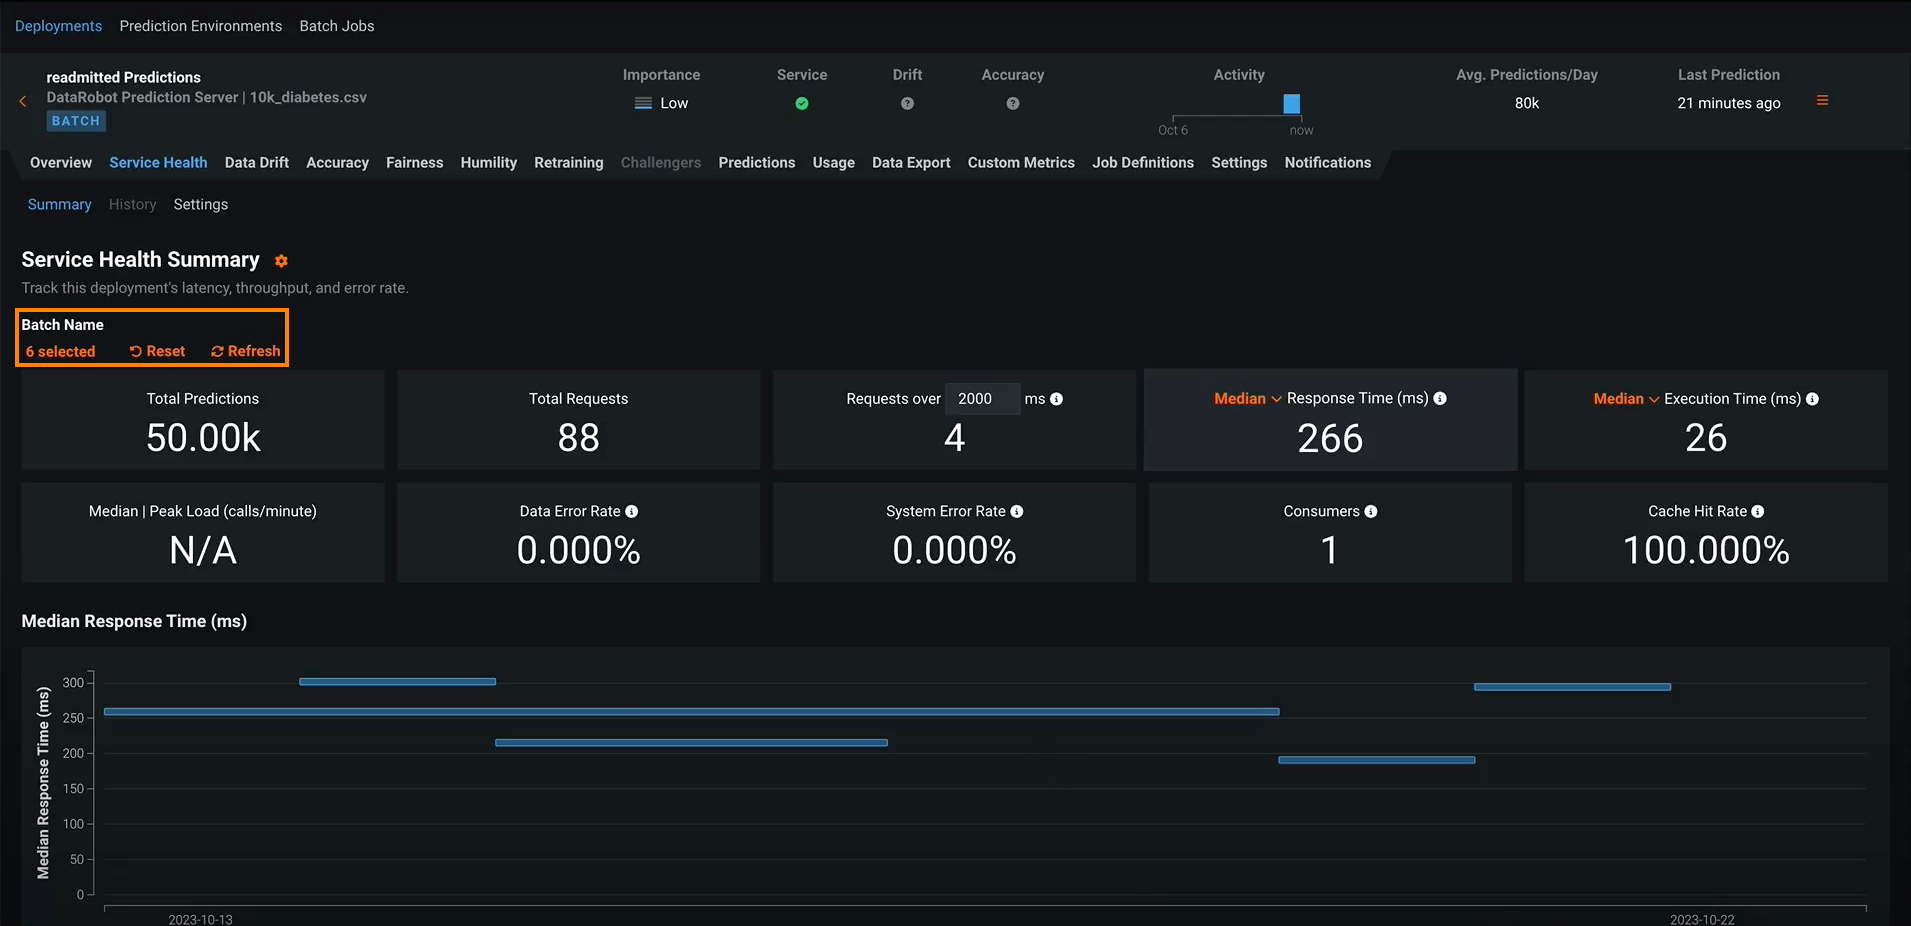
On the Service Health tab, you can view the Total Predictions chart. On this chart, the bars represent batches, the x-axis represents the time from the earliest prediction to the latest, and the y-axis is the total number of predictions in that batch. You can use the Batch Name selector to determine which batches are included:
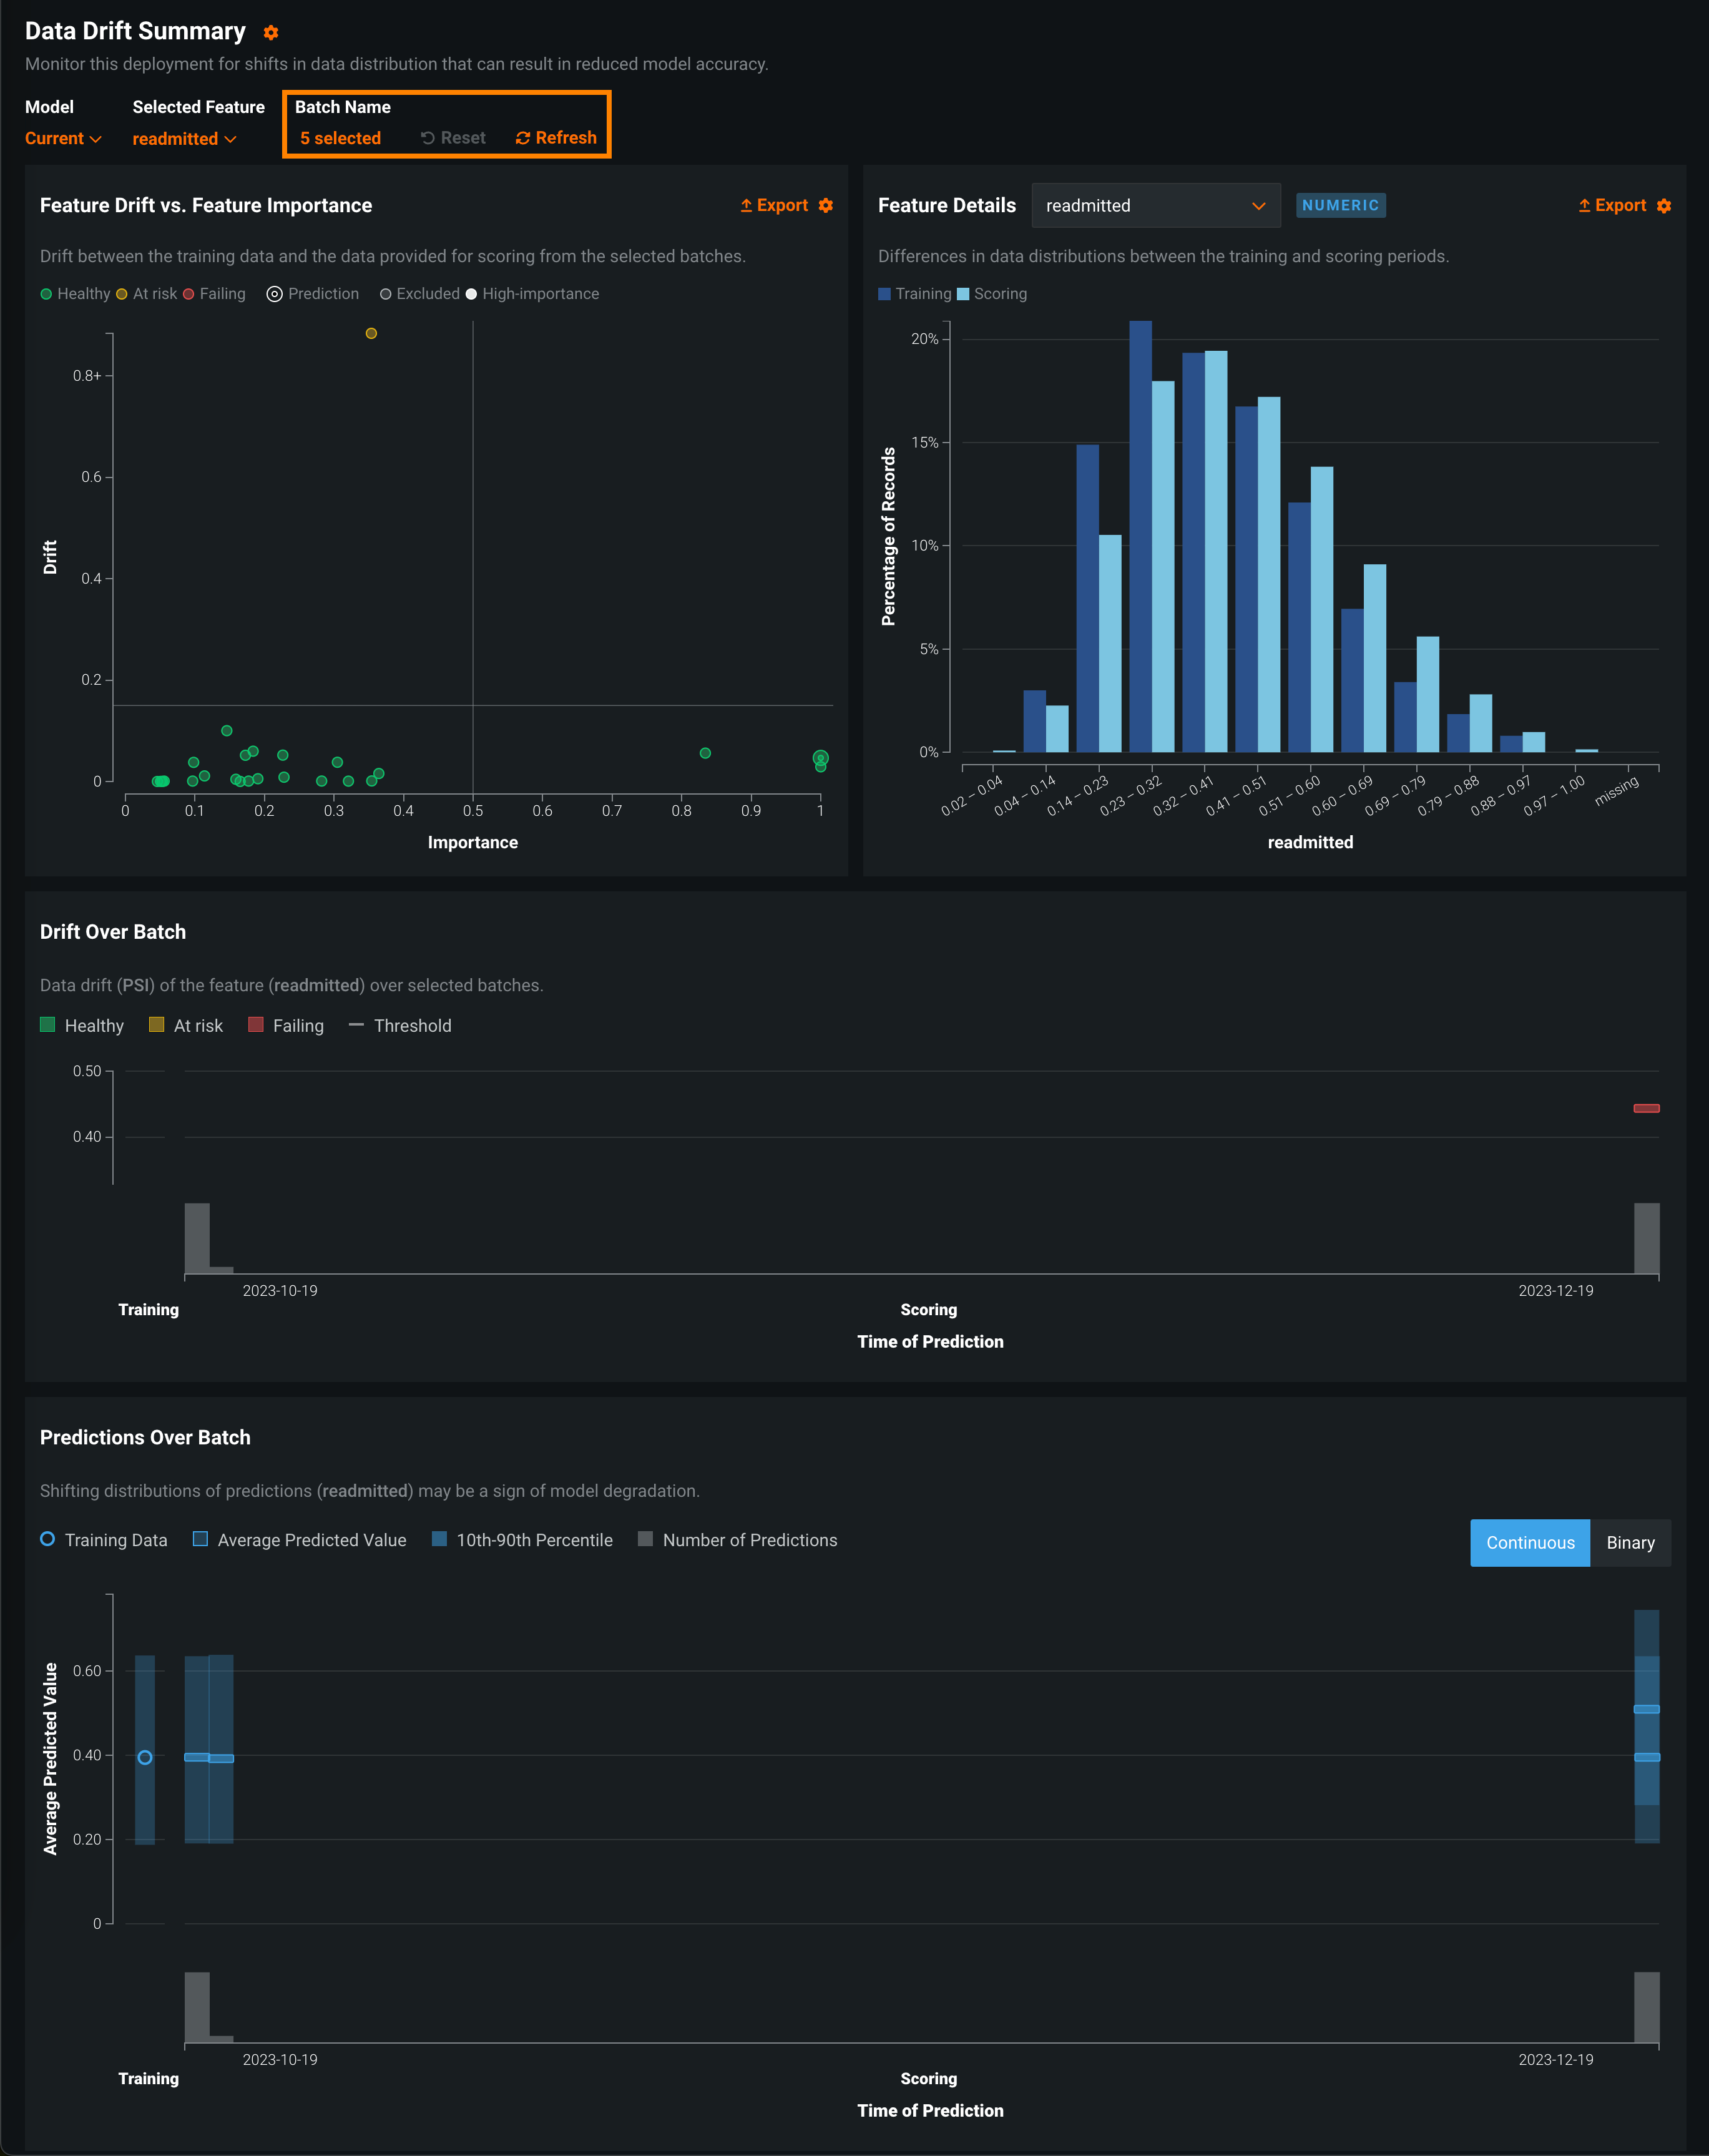
On the Data Drift tab, you can view the Feature Drift vs. Feature Importance, Feature Details, Drift Over Batch, and Predictions Over Batch charts. You can use the Batch Name selector to determine which batches are included:
| Chart | Description |
|---|---|
| Feature Drift vs. Feature Importance | A chart plotting a feature's importance on the x-axis vs. its drift value on the y-axis. For more information, see the Feature Drift vs. Feature Importance documentation. |
| Feature Details | A histogram comparing the distribution of a selected feature in the training data to the distribution of that feature in the inference data. For more information, see the Feature Details documentation. |
| Drift Over Batch | A chart plotting batches as bars where the bar width along the x-axis represents the time from the earliest prediction to the latest and the location on the y-axis represents the data drift value for a selected feature (in PSI) for that batch. The feature visualized is determined by the feature selected in the Feature Details chart. |
| Predictions Over Batch | A chart plotting batches as bars where the bar width along the x-axis represents the time from the earliest prediction to the latest and the location on the y-axis represents either the average predicted value (Continuous) or the percentage of records in the class (Binary). |
On the Accuracy tab, you can view the accuracy metric values for a batch deployment. You can use the Batch Name selector to determine which batches are included. In addition, to customize the metrics visible on the tab, you can click Customize tiles:
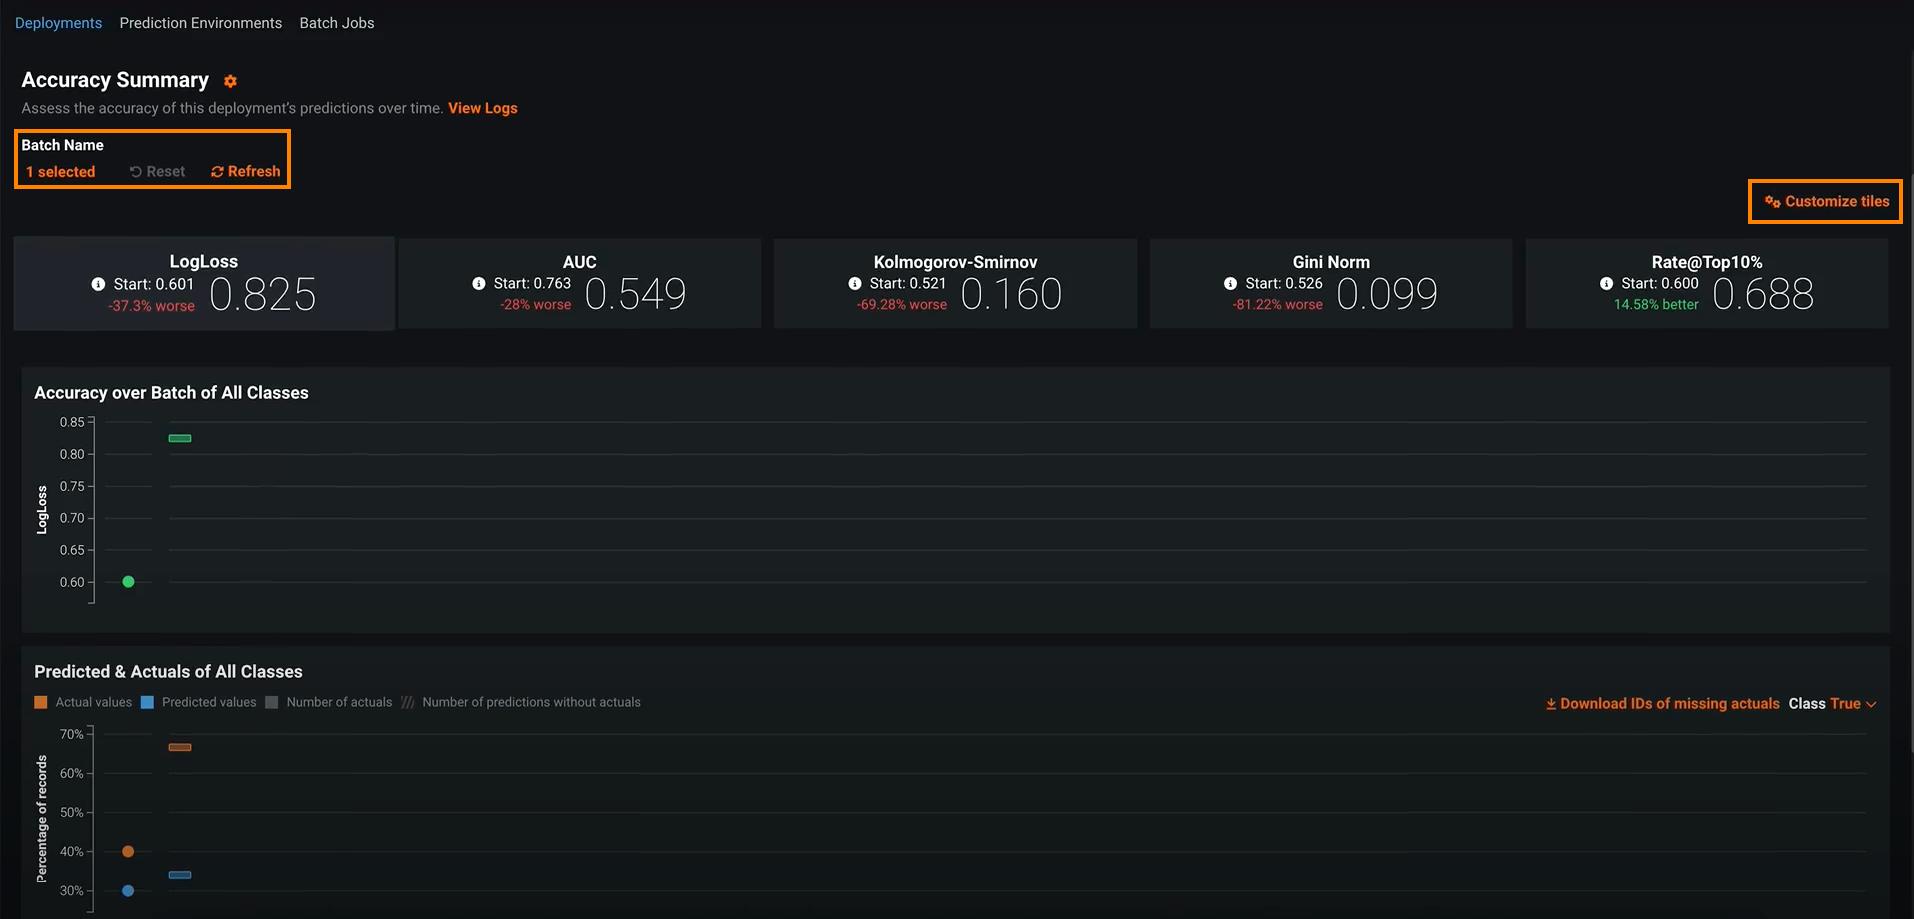
You can also view the following accuracy charts:
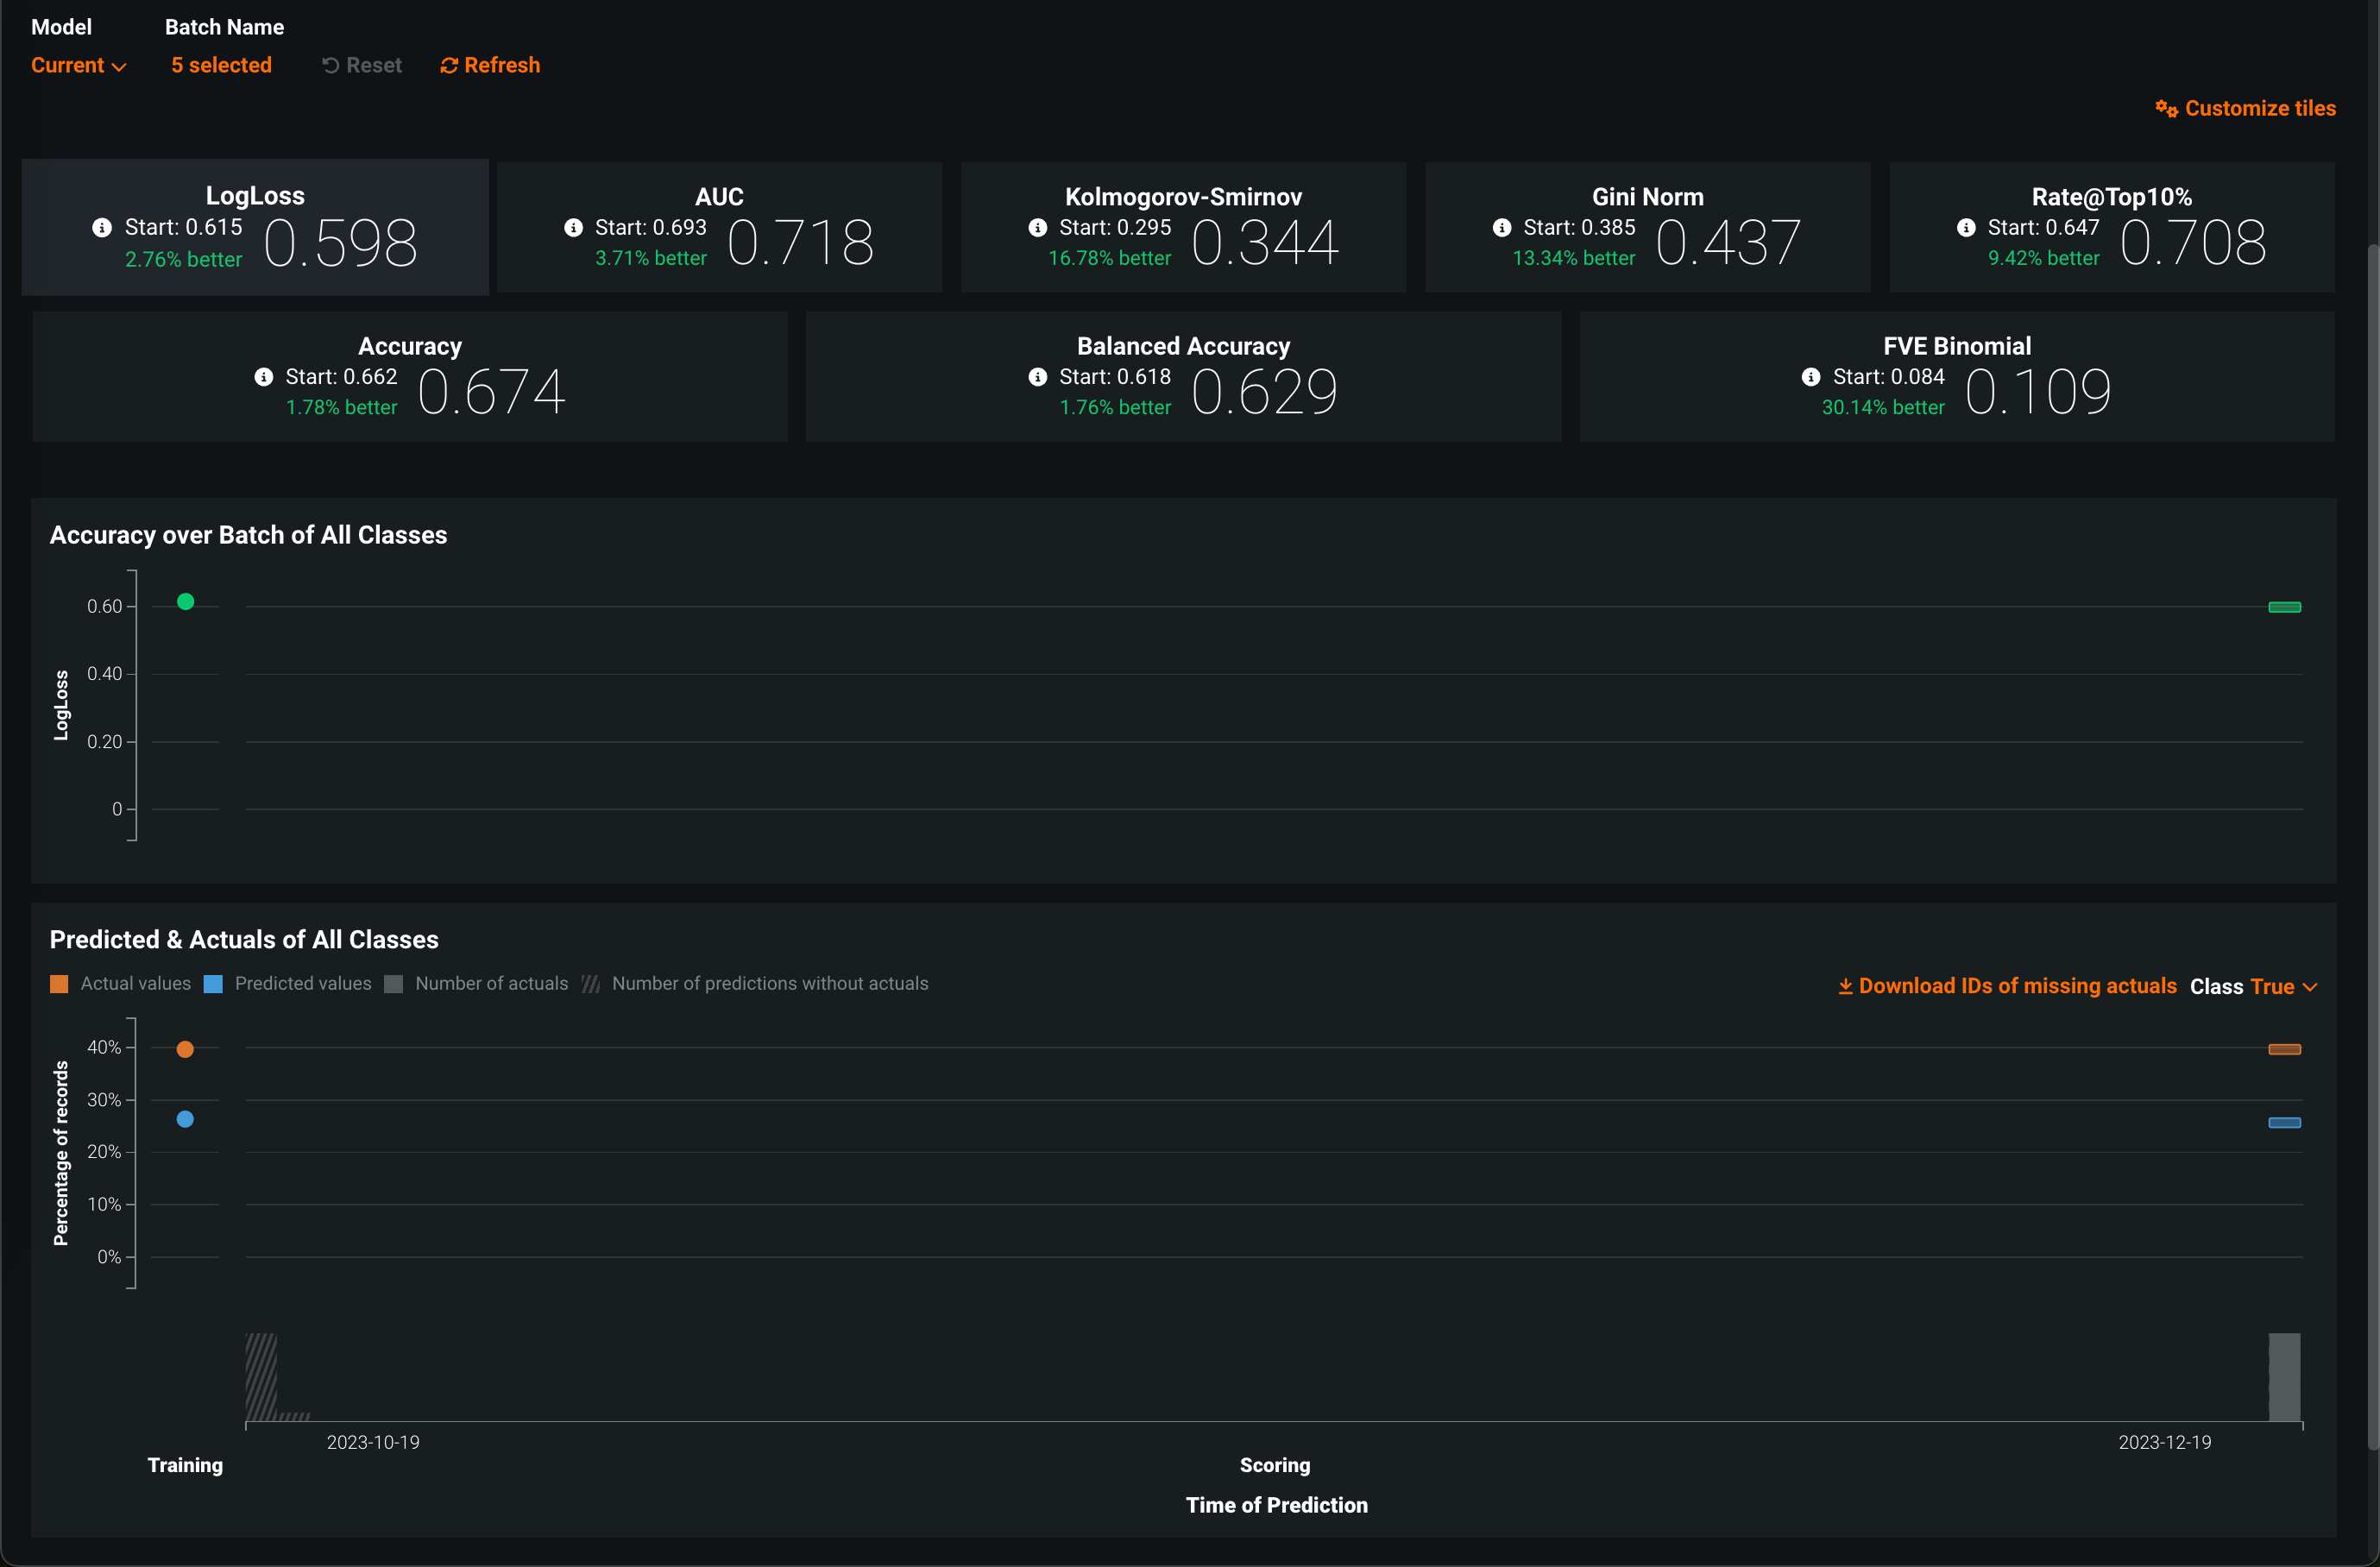
| Chart | Description |
|---|---|
| Accuracy over Batch of All Classes | A chart plotting batches as bars where the bar width along the x-axis represents the time from the earliest prediction to the latest and the location on the y-axis represents the accuracy value for that batch. |
| Predicted & Actuals of All Classes | For classification project deployments, a chart plotting batches as bars. For each batch, the bar width along the x-axis represents the time from the earliest prediction to the latest and the location on the y-axis represents the percentage of prediction records in the selected class (configurable in the Class drop-down menu). Actual values are in orange and Predicted values are in blue. From this chart, you can Download IDs of missing actuals. |
In addition to service health, data drift, and accuracy monitoring, you can configure data exploration and custom metrics for batch deployments. On both of these tabs, you can use the Batch Name selector to determine which batches are included:
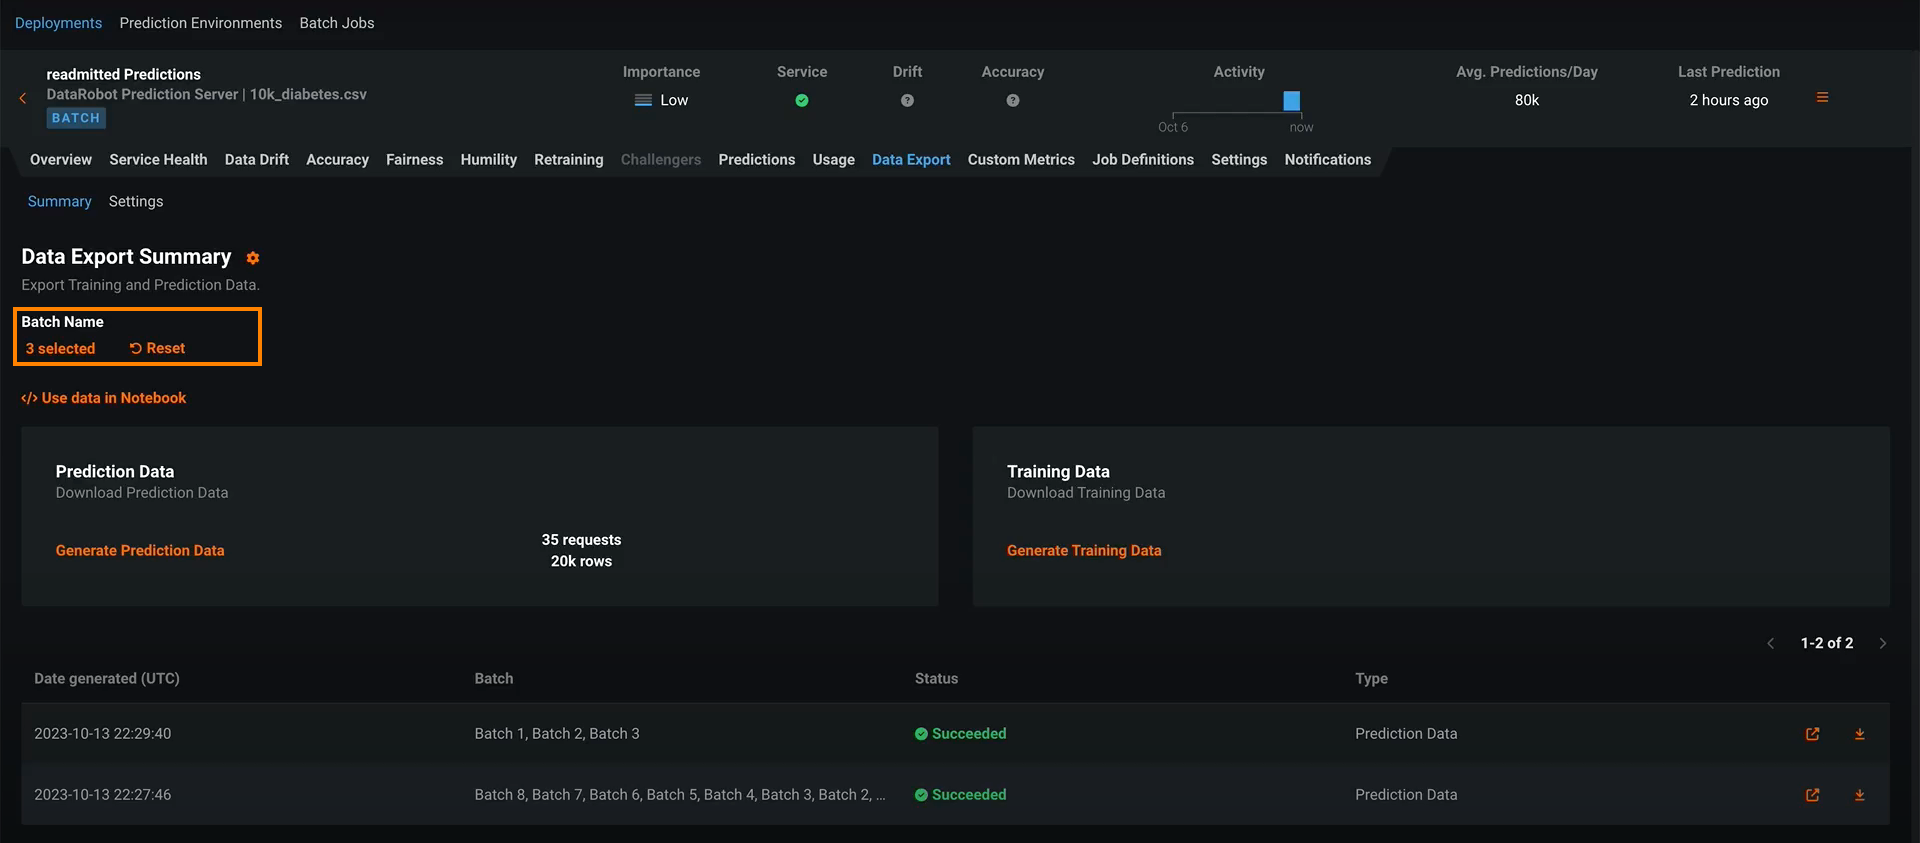
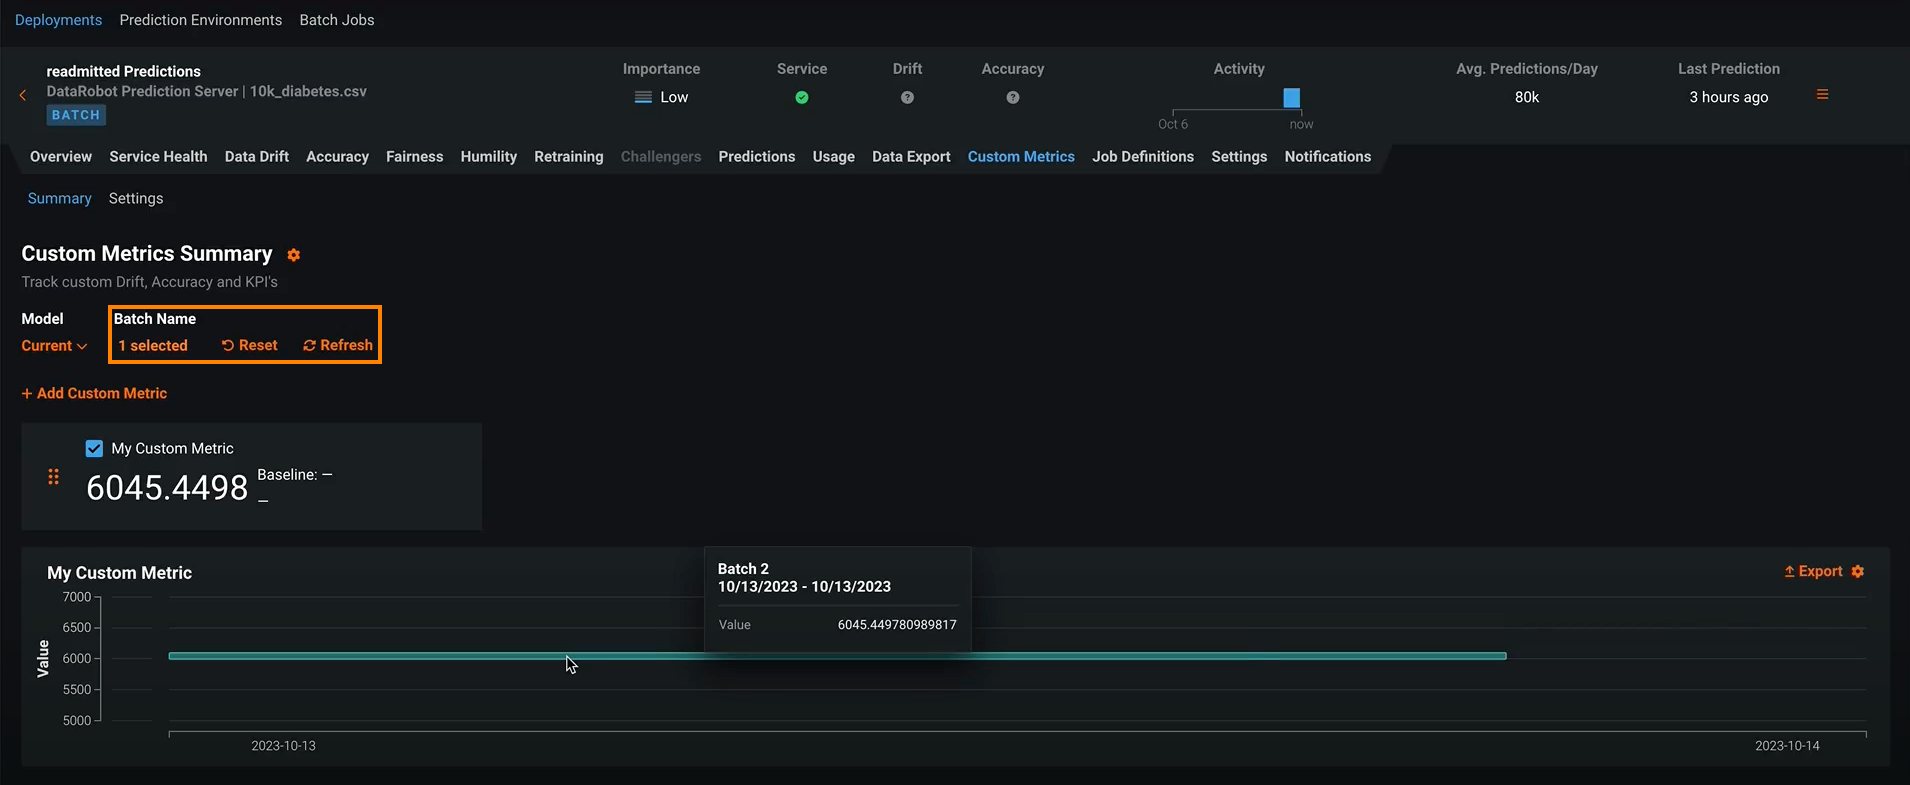
In the Select batches modal, click to select a batch, moving it to the right (selected) column. You can also click to remove a selected batch, returning it to the left (unselected) column.
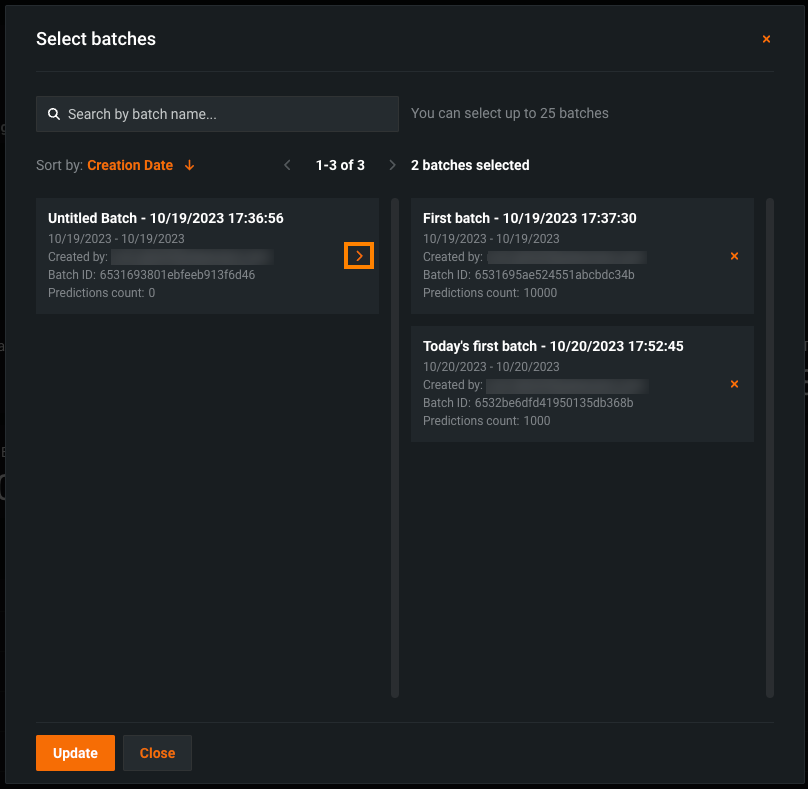
Note
By default, batch monitoring visualizations display the last 10 batches to receive a prediction. You can change the selected batches, selecting a maximum of 25 batches.