Frozen runs
To tune model performance on a sample, DataRobot systematically applies many parameter combinations to progressively narrow the search for the optimum model. Trying many parameter combinations is costly, however. As the sample size increases, the time taken for grid search (finding the best parameter settings for a model) increases exponentially.
DataRobot’s "frozen run" feature addresses this by "freezing" parameter settings from a model’s early, small sample size-based run. Because parameter settings based on smaller samples tend to also perform well on larger samples of the same data, DataRobot can piggyback on its early experimentation. Using parameter settings from the earlier pass and injecting them into the new model as it is training saves time, RAM, and CPU resources without much cost in model accuracy or performance. These savings are particularly important when working with big datasets or on resource-constrained systems.
To avoid costly runs for large (over 1.5GB) datasets, you can only launch sample percentage changes to a Leaderboard model as a frozen run. If you are using Smart Downsampling, the threshold applies to the size of the dataset after subsampling.
Start a frozen run
A frozen run, because it relies on previously determined parameters, can only be launched from an existing model on the Leaderboard. To use the frozen run feature:
-
Run Autopilot or build a model using Manual mode. Use a sample size that can complete in a reasonable time (determined by your system resources and dataset), but is not so small that the parameter optimization search cannot identify good parameter values.
-
When the model build(s) are complete, open the model Leaderboard.
-
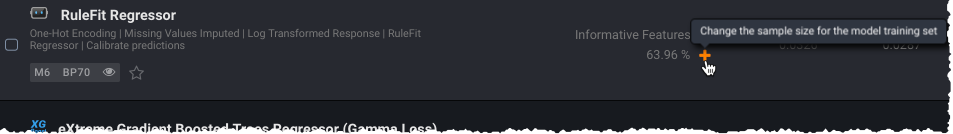
For each model that you want to re-run with more data, click the plus sign next to the reported sample size:
-
Set a new sample size and click the snowflake icon:
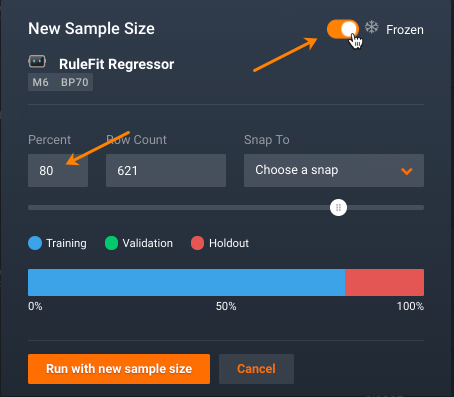
Use one of the following methods to update the sample size:
- Enter a percentage value (Percent field) or number of rows (Row Count field).
- Use the slider to set values based on a visual indicator.
- Click in the Snap To box for quick access to the default percentages that DataRobot uses for training and other significant values.
Note
When configuring sample sizes to retrain models in projects with large row counts, DataRobot recommends requesting sample sizes using integer row counts or the Snap To Validation option instead of percentages. This is because percentages map to many actual possible row counts and only one of which is the actual sample size for “up to validation.” For example, if a project has 199,408 rows and you request a 64% sample size, any number of rows between 126,625 rows and 128,618 rows maps to "64%" of the data. Using integer row counts or the “Snap-to” options avoids ambiguity around how many rows of data you want the model to use.
Note that all values adjust as you update the sample size.
-
Click Run with new sample size to start a model build using the parameter settings from the selected model on the sample size you just set.
Frozen run Leaderboard items are indicated with a snowflake icon; the sample percentage used to obtain the parameters is displayed alongside that icon.
Compare frozen run models
Once the model build completes, you should determine whether the speed and resource improvements are worth any potential cost in accuracy. The new model appears on the Leaderboard:
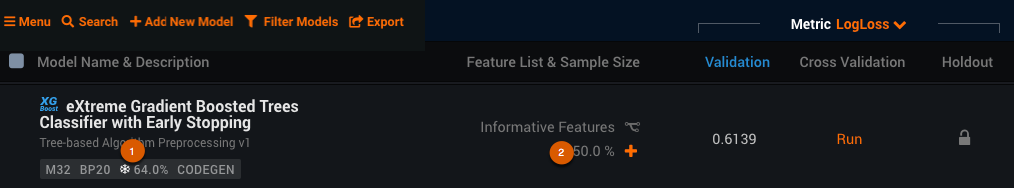
- Snowflake (1): The icon and percentage indicate that the model was based on “frozen” parameter settings from the 64% sample size version of the model.
- Sample Size (2): The sample size, as always, indicates the percentage of the training dataset that was used to build the model. This example shows a 64% model that was retrained to 50%.
Compare the following:
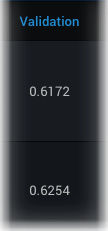
To compare accuracy between models, set the metric to a value you want to measure and check the Validation scores:
Click on the newly created model and then click the Model Info tab. The resulting page displays a resource usage summary detailing core use, RAM, build time and other statistics, as well as sample and model file size details.
Compare the information from these screens against your needs for speed and accuracy.
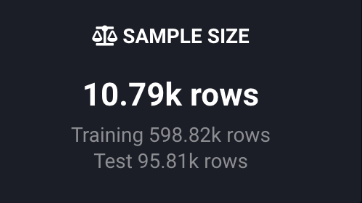
Note that under the Model Info tab for Smart Downsampled projects, the row count ("rows") in the SAMPLE SIZE tile represents the number of rows after downsampling. However, the Training and Test data sizes list the number of rows before downsampling occurs.