Monitoring jobs for custom metrics
Availability information
Monitoring jobs for custom metrics are off by default. Contact your DataRobot representative or administrator for information on enabling this feature.
Feature flag: Enable Custom Metrics Job Definitions
Monitoring job definitions allow DataRobot to pull calculated custom metric values from outside of DataRobot into the custom metric defined on the Custom Metrics tab, supporting custom metrics with external data sources. For example, you can create a monitoring job to connect to Snowflake, fetch custom metric data from the relevant Snowflake table, and send the data to DataRobot.
To create the monitoring jobs for custom metrics:
-
Click Deployments and select a deployment from the inventory.
-
On the selected deployment's Overview, click Job Definitions.
-
On the Job Definitions page, click Monitoring Jobs, and then click Add Job Definition.
-
On the New Monitoring Job Definition page, configure the following options:
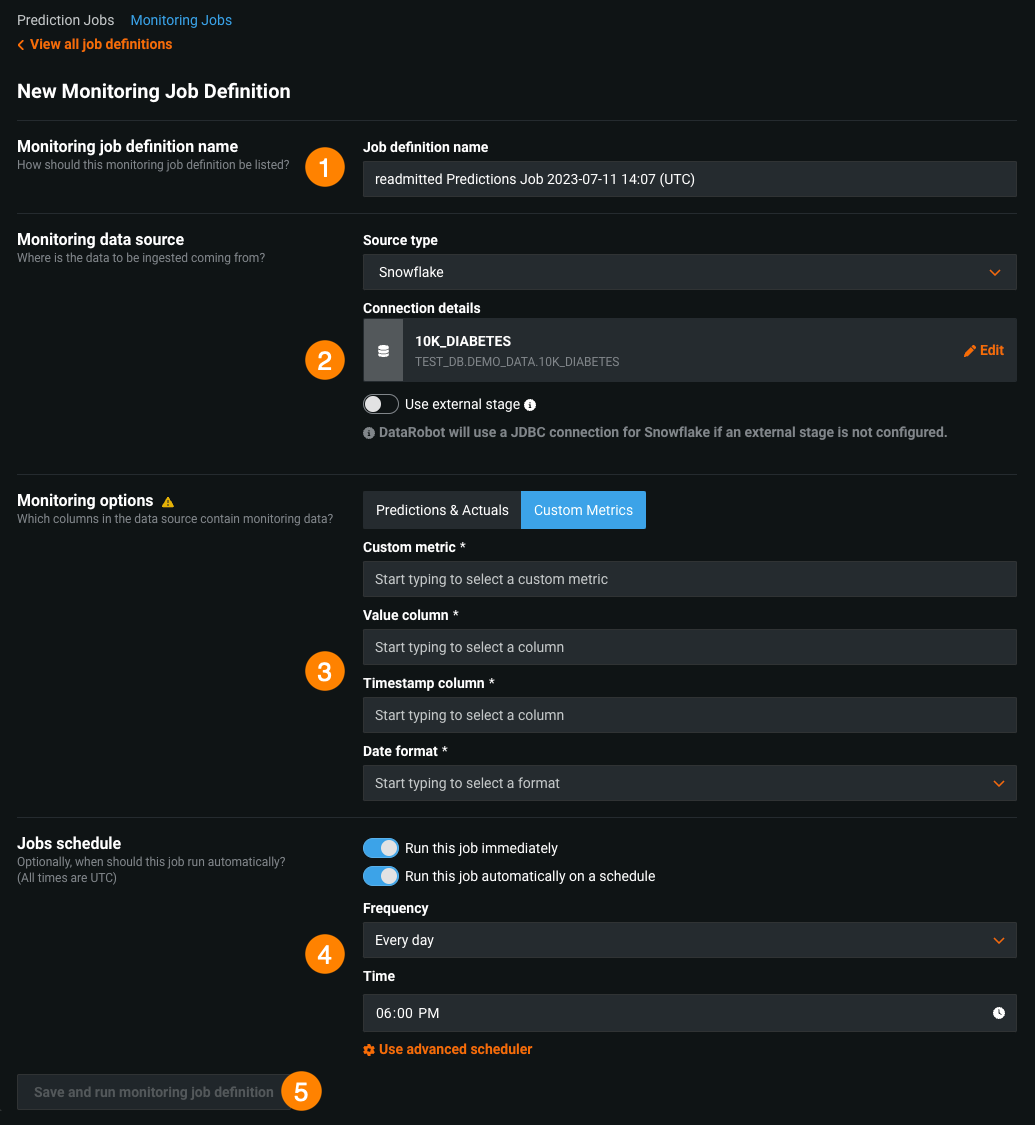
Field name Description 1 Monitoring job definition name Enter the name of the monitoring job that you are creating for the deployment. 2 Monitoring data source Set the source type and define the connection for the data to be scored. 3 Monitoring options Configure custom model monitoring options. 4 Jobs schedule Configure whether to run the job immediately and whether to schedule the job. 5 Save monitoring job definition Click this button to save the job definition. The button changes to Save and run monitoring job definition if Run this job immediately is enabled. Note that this button is disabled if there are any validation errors.
Set monitoring data source
In the Monitoring data source section, select a Source type (called an intake adapter) and complete the appropriate authentication workflow for the source type in the Connection details section.
Select a connection type below to view field descriptions:
Note
When browsing for connections, invalid adapters are not shown.
Database connections
Cloud Storage Connections
Data Warehouse Connections
Other
After you set your monitoring source, DataRobot validates that the data applies to the deployed model.
Note
DataRobot validates that a data source is compatible with the model when possible, but not in all cases. DataRobot validates for AI Catalog, most JDBC connections, Snowflake, and Synapse.
Set custom model monitoring options
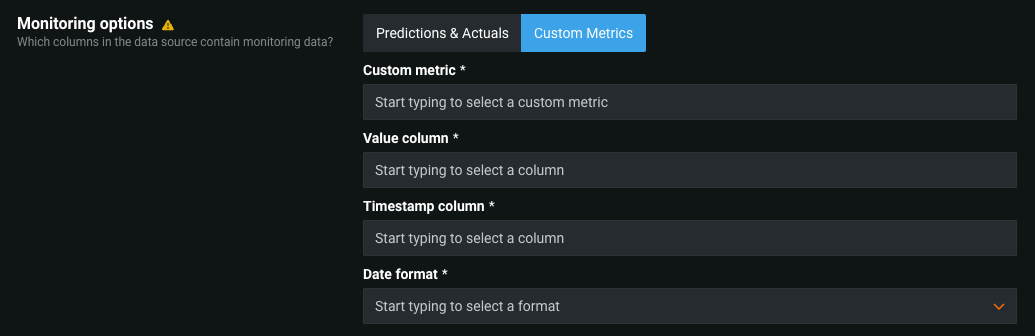
In the Monitoring options section, click Custom Metrics and configure the following options:
| Field | Description |
|---|---|
| Custom metric | Select the custom metric you want to monitor from the current deployment. |
| Value column | Select the column in the dataset containing the calculated values of the custom metric. |
| Timestamp column | Select the column in the dataset containing a timestamp. |
| Date format | Select the date format used by the timestamp column. |
Schedule monitoring jobs
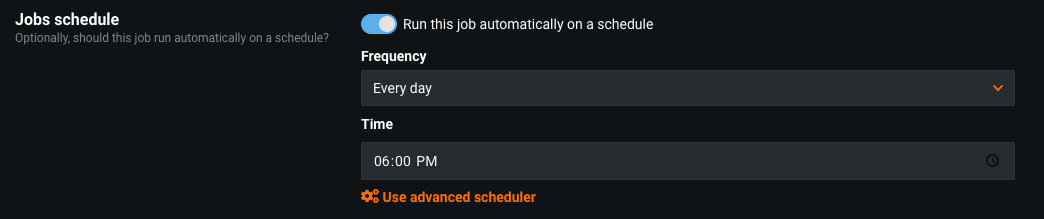
You can schedule monitoring jobs to run automatically on a schedule. When outlining a monitoring job definition, enable Run this job automatically on a schedule, then specify the frequency (daily, hourly, monthly, etc.) and time of day to define the schedule on which the job runs.
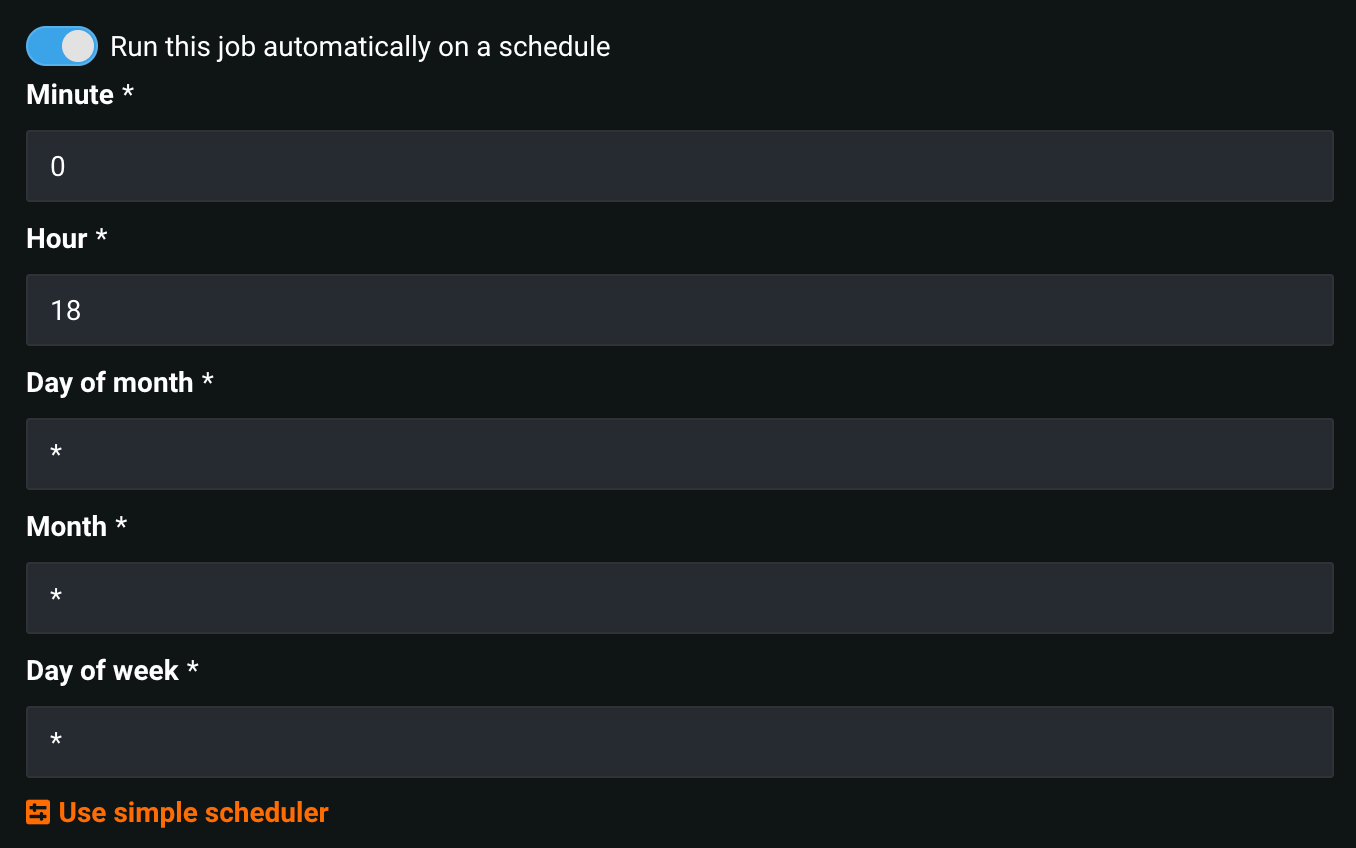
For further granularity, select Use advanced scheduler. You can set the exact time (to the minute) you want to run the monitoring job.
After setting all applicable options, click Save monitoring job definition.