Run the monitoring agent in DataRobot
Availability information
The monitoring agent in DataRobot is a preview feature, on by default.
Feature flags: Disable the Monitoring Agent in DataRobot
The monitoring agent typically runs outside of DataRobot, reporting metrics from a configured spooler populated by calls to the DataRobot MLOps library in the external model's code. Now available for preview, you can run the monitoring agent inside DataRobot by creating an external prediction environment with an external spooler's credentials and configuration details.
To create a prediction environment associated with an external spooler:
-
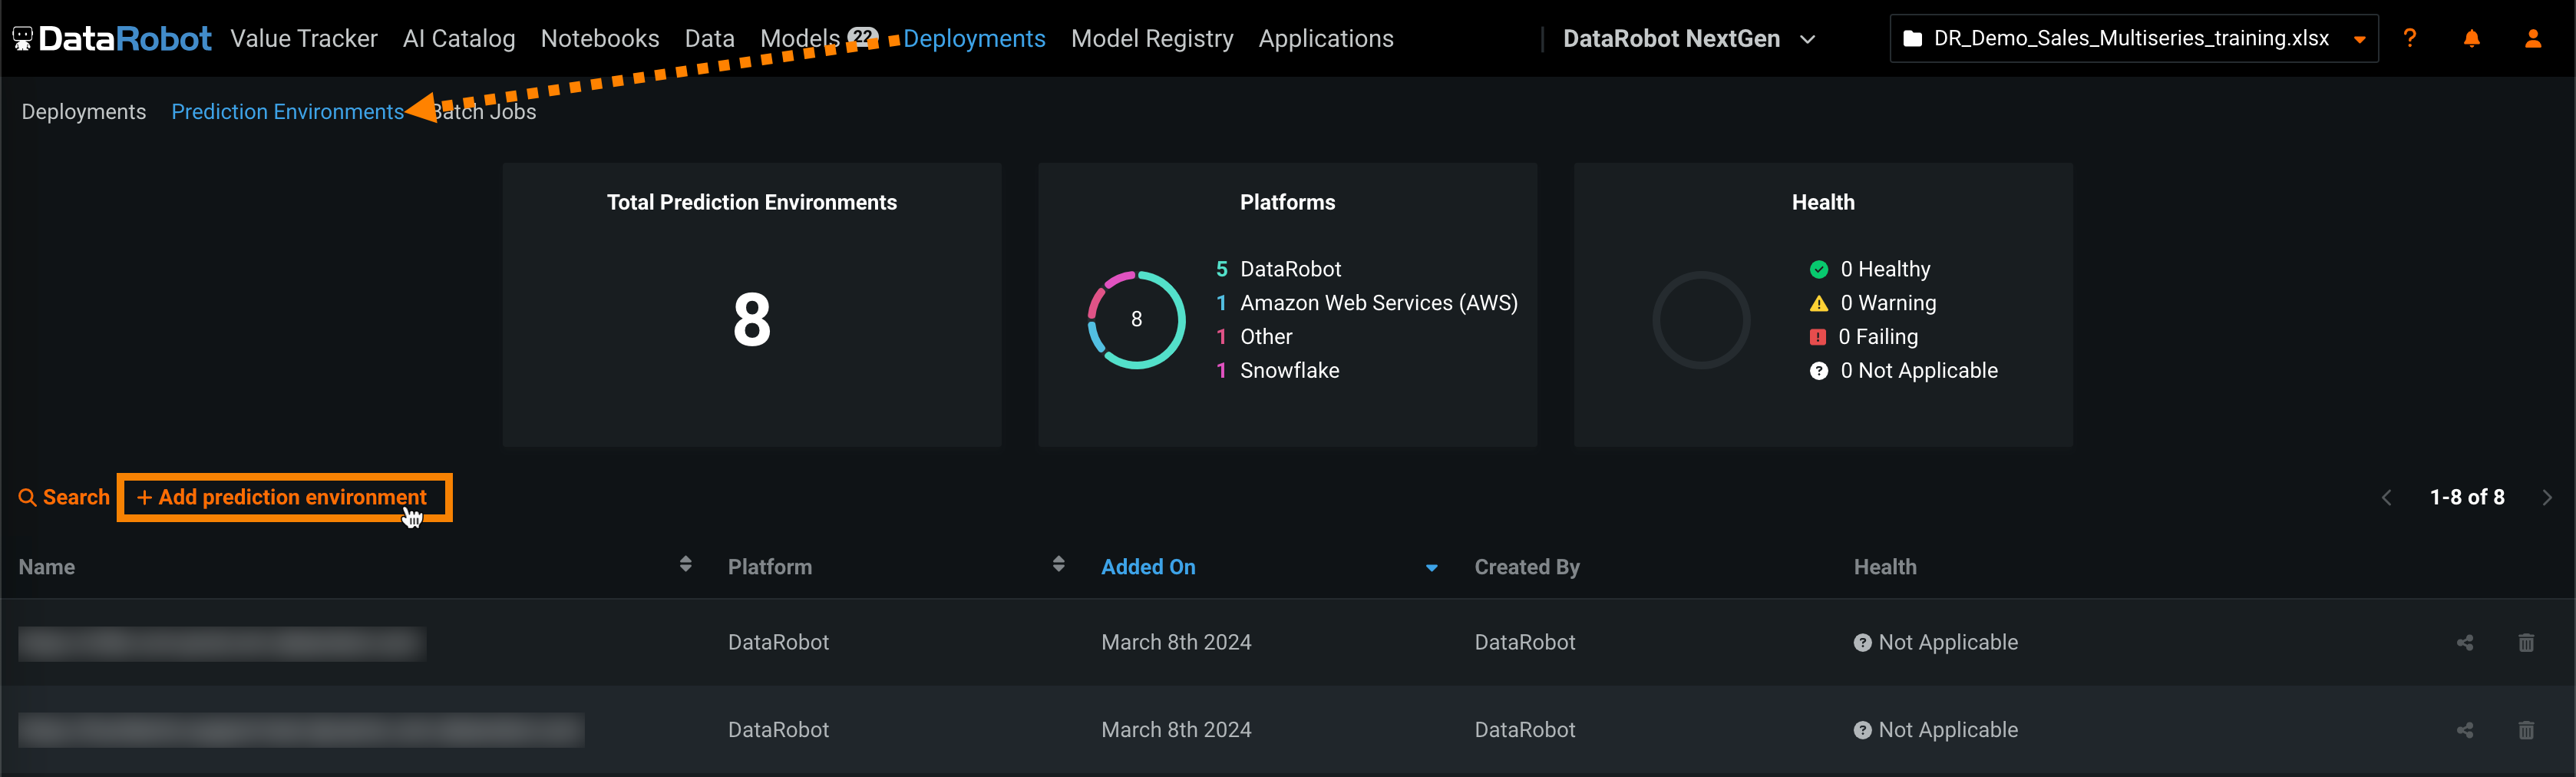
Click Deployments > Prediction Environments and then click Add prediction environment.
-
In the Add prediction environment dialog box, complete the following fields:
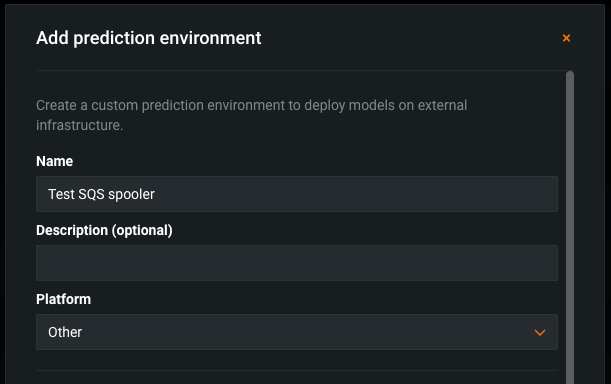
Field Description Name Enter a descriptive prediction environment name. Description (Optional) Enter a description of the external prediction environment. Platform Select the external platform on which the model is running and making predictions. -
Under Supported model formats, select one or more formats to control which models can be deployed to the prediction environment, either manually or using the management agent. The available model formats are DataRobot or DataRobot Scoring Code only, External Model, and Custom Model.
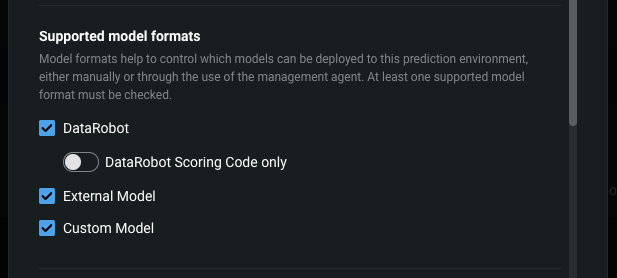
Important
You cannot select both DataRobot and DataRobot Scoring Code only.
-
Under Managed by, select Managed by DataRobot. The following options are provided:
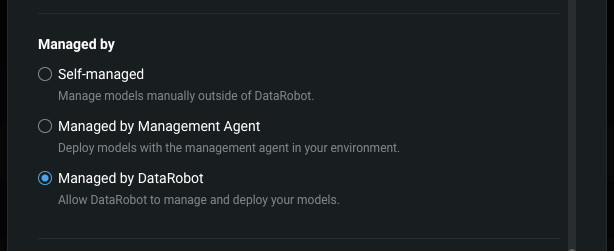
Option Description Self-managed Manually manage models on your infrastructure and report data manually to DataRobot. Managed by Management Agent Manage models with the Management Agent on your own infrastructure. Managed by DataRobot Manage models with the Management Agent inside DataRobot. This option is only available if the Platform selected is Azure or Snowflake. -
Under Settings, select a Queue:
Select the AWS S3 Credentials for your Amazon SQS spooler and configure the following Amazon SQS fields:
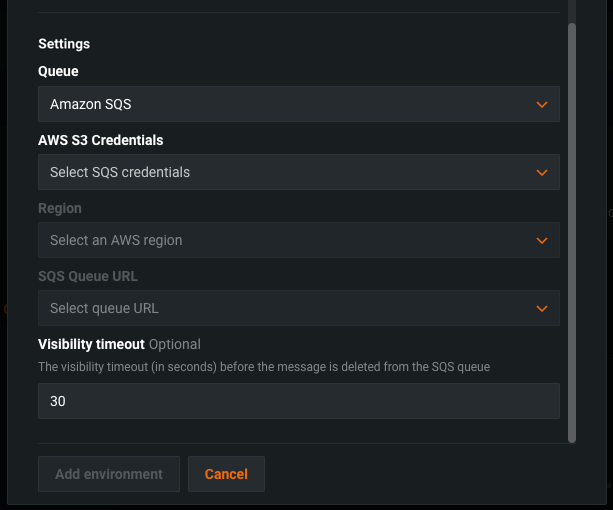
Field Description Region Select the AWS region used for the queue. SQS Queue URL Select the URL of the SQS queue used for the spooler. Visibility timeout (Optional) The visibility timeout before the message is deleted from the queue. This is an Amazon SQS configuration not specific to the monitoring agent. After you configure the Queue settings you can provide any Environment variables accepted by the Amazon SQS spooler. For more information, see the Amazon SQS spooler reference.
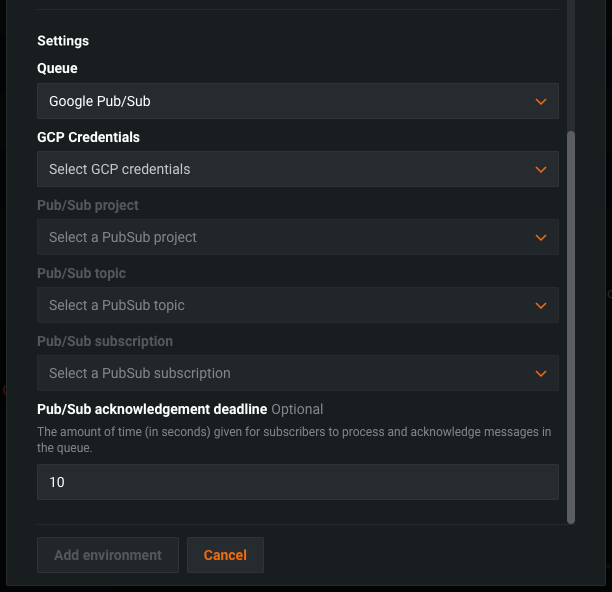
Select the GCP Credentials for your Google Pub/Sub spooler and configure the following Google Pub/Sub fields:
Field Description Pub/Sub project Select the Pub/Sub project used by the spooler. Pub/Sub topic Select the Pub/Sub topic used by the spooler; this should be the topic name within the project, not the fully qualified topic name path that includes the project ID. Pub/Sub subscription Select the Pub/Sub subscription name of the subscription used by the spooler. Pub/Sub acknowledgment deadline (Optional) Enter the amount of time (in seconds) for subscribers to process and acknowledge messages in the queue. After you configure the Queue settings you can provide any Environment variables accepted by the Google Pub/Sub spooler. For more information, see the Google Cloud Pub/Sub spooler reference.
Select the Azure Service Principal Credentials for your Azure Event Hubs spooler and configure the Azure Subscription and Azure Resource Group fields accessible using the provided Credentials:
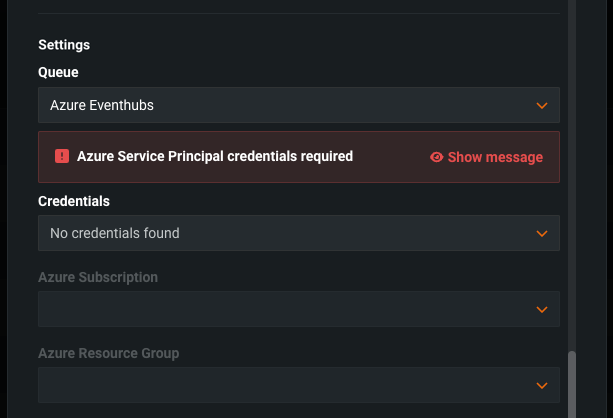
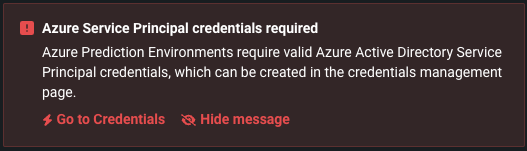
Azure Service Principal credentials required
DataRobot management of Scoring Code in AzureML requires existing Azure Service Principal Credentials. If you don't have existing credentials, the Azure Service Principal credentials required alert appears, directing you to Go to Credentials to create Azure Service Principal credentials.
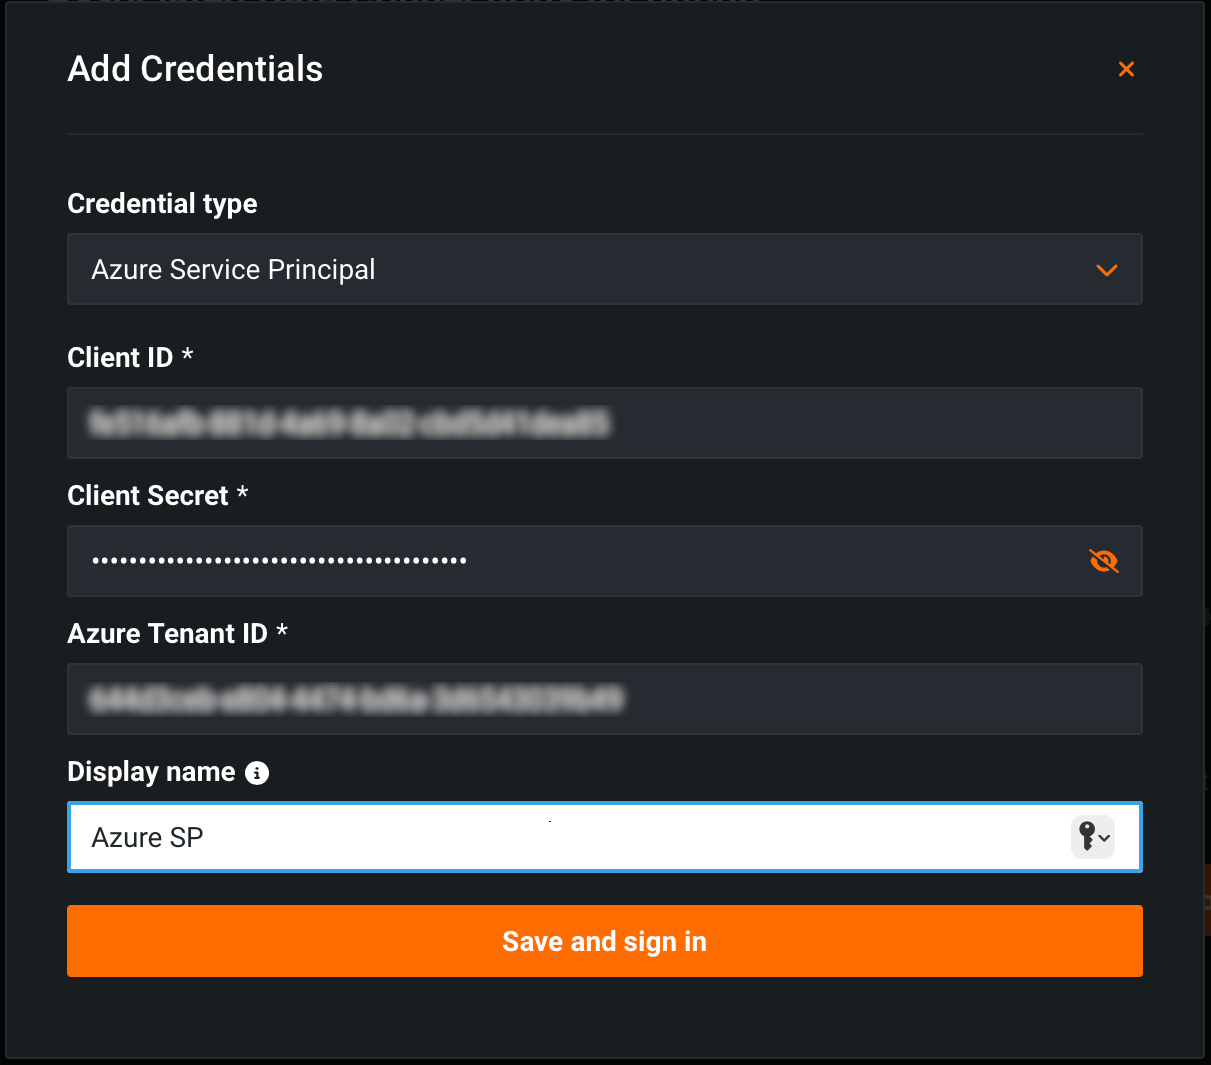
To create the required credentials, for Credential type, select Azure Service Principal. Then, enter a Client ID, Client Secret, Azure Tenant ID, and a Display name. To validate and save the credentials, click Save and sign in.
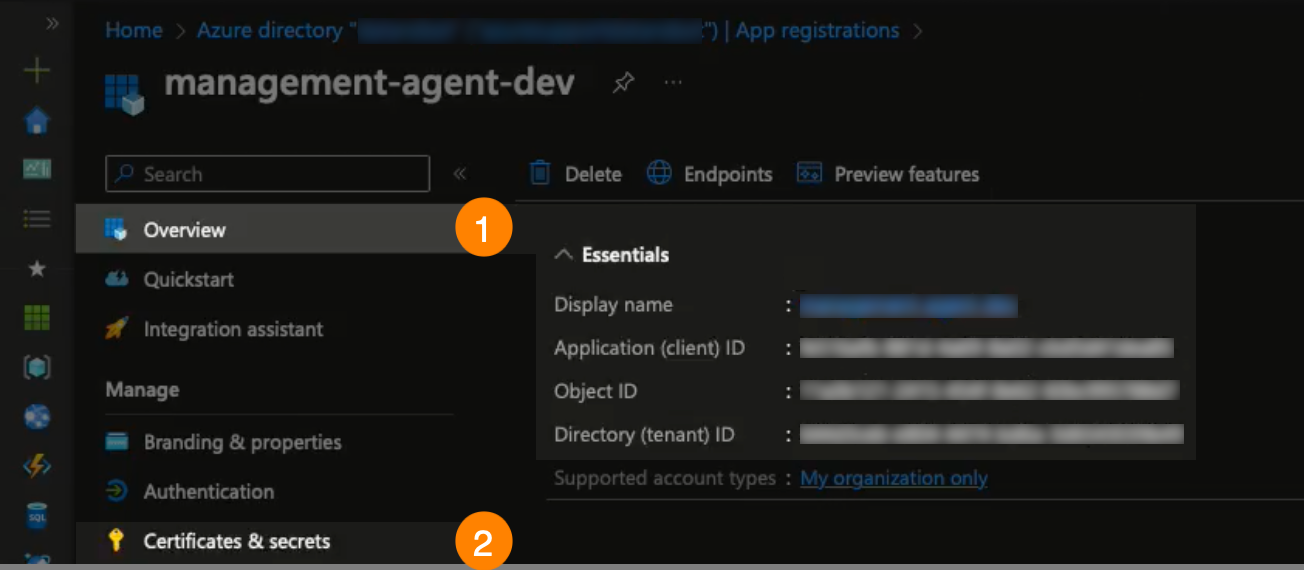
You can find these IDs and the display name on Azure's App registrations > Overview tab (1). You can generate secrets on the App registration > Certificates and secrets tab(2):
Next, configure the following Azure Event Hubs fields:
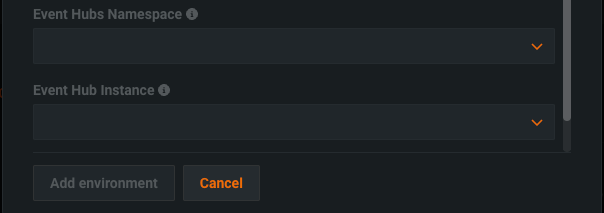
Field Description Event Hubs Namespace Select a valid Event Hubs namespace retrieved from the Azure Subscription ID. Event Hub Instance Select an Event Hubs instance within your namespace for monitoring data. After you configure the Queue settings, you can provide any Environment variables accepted by the Azure Event Hubs spooler. For more information, see the Azure Event Hubs spooler reference.
-
Once you configure the environment settings, click Add environment.
The environment is now available from the Prediction Environments page.
Manage an agent-monitored prediction environment
When you add a prediction environment with monitoring settings configured, you can view the health and status of that prediction environment, edit the queue settings, and stop or start the agent. On the Deployments > Prediction Environments tab, locate the agent-monitored and managed environment. From the prediction environment inventory, you can view the Name, Platform, Added On date, Created By date, and Health. You can also edit, share, and delete prediction environments. For more information, see the Manage prediction environments documentation.
Copy prediction environment ID
From the upper-left corner of either tab in a prediction environment, you can click the copy icon () to copy the Prediction Environment ID.
From the Details tab, you can edit the prediction environment Name, Description, Platform, Supported model formats, Managed by setting, and associated Service Account. In the Usages section, you can view and access deployments associated with the environment:
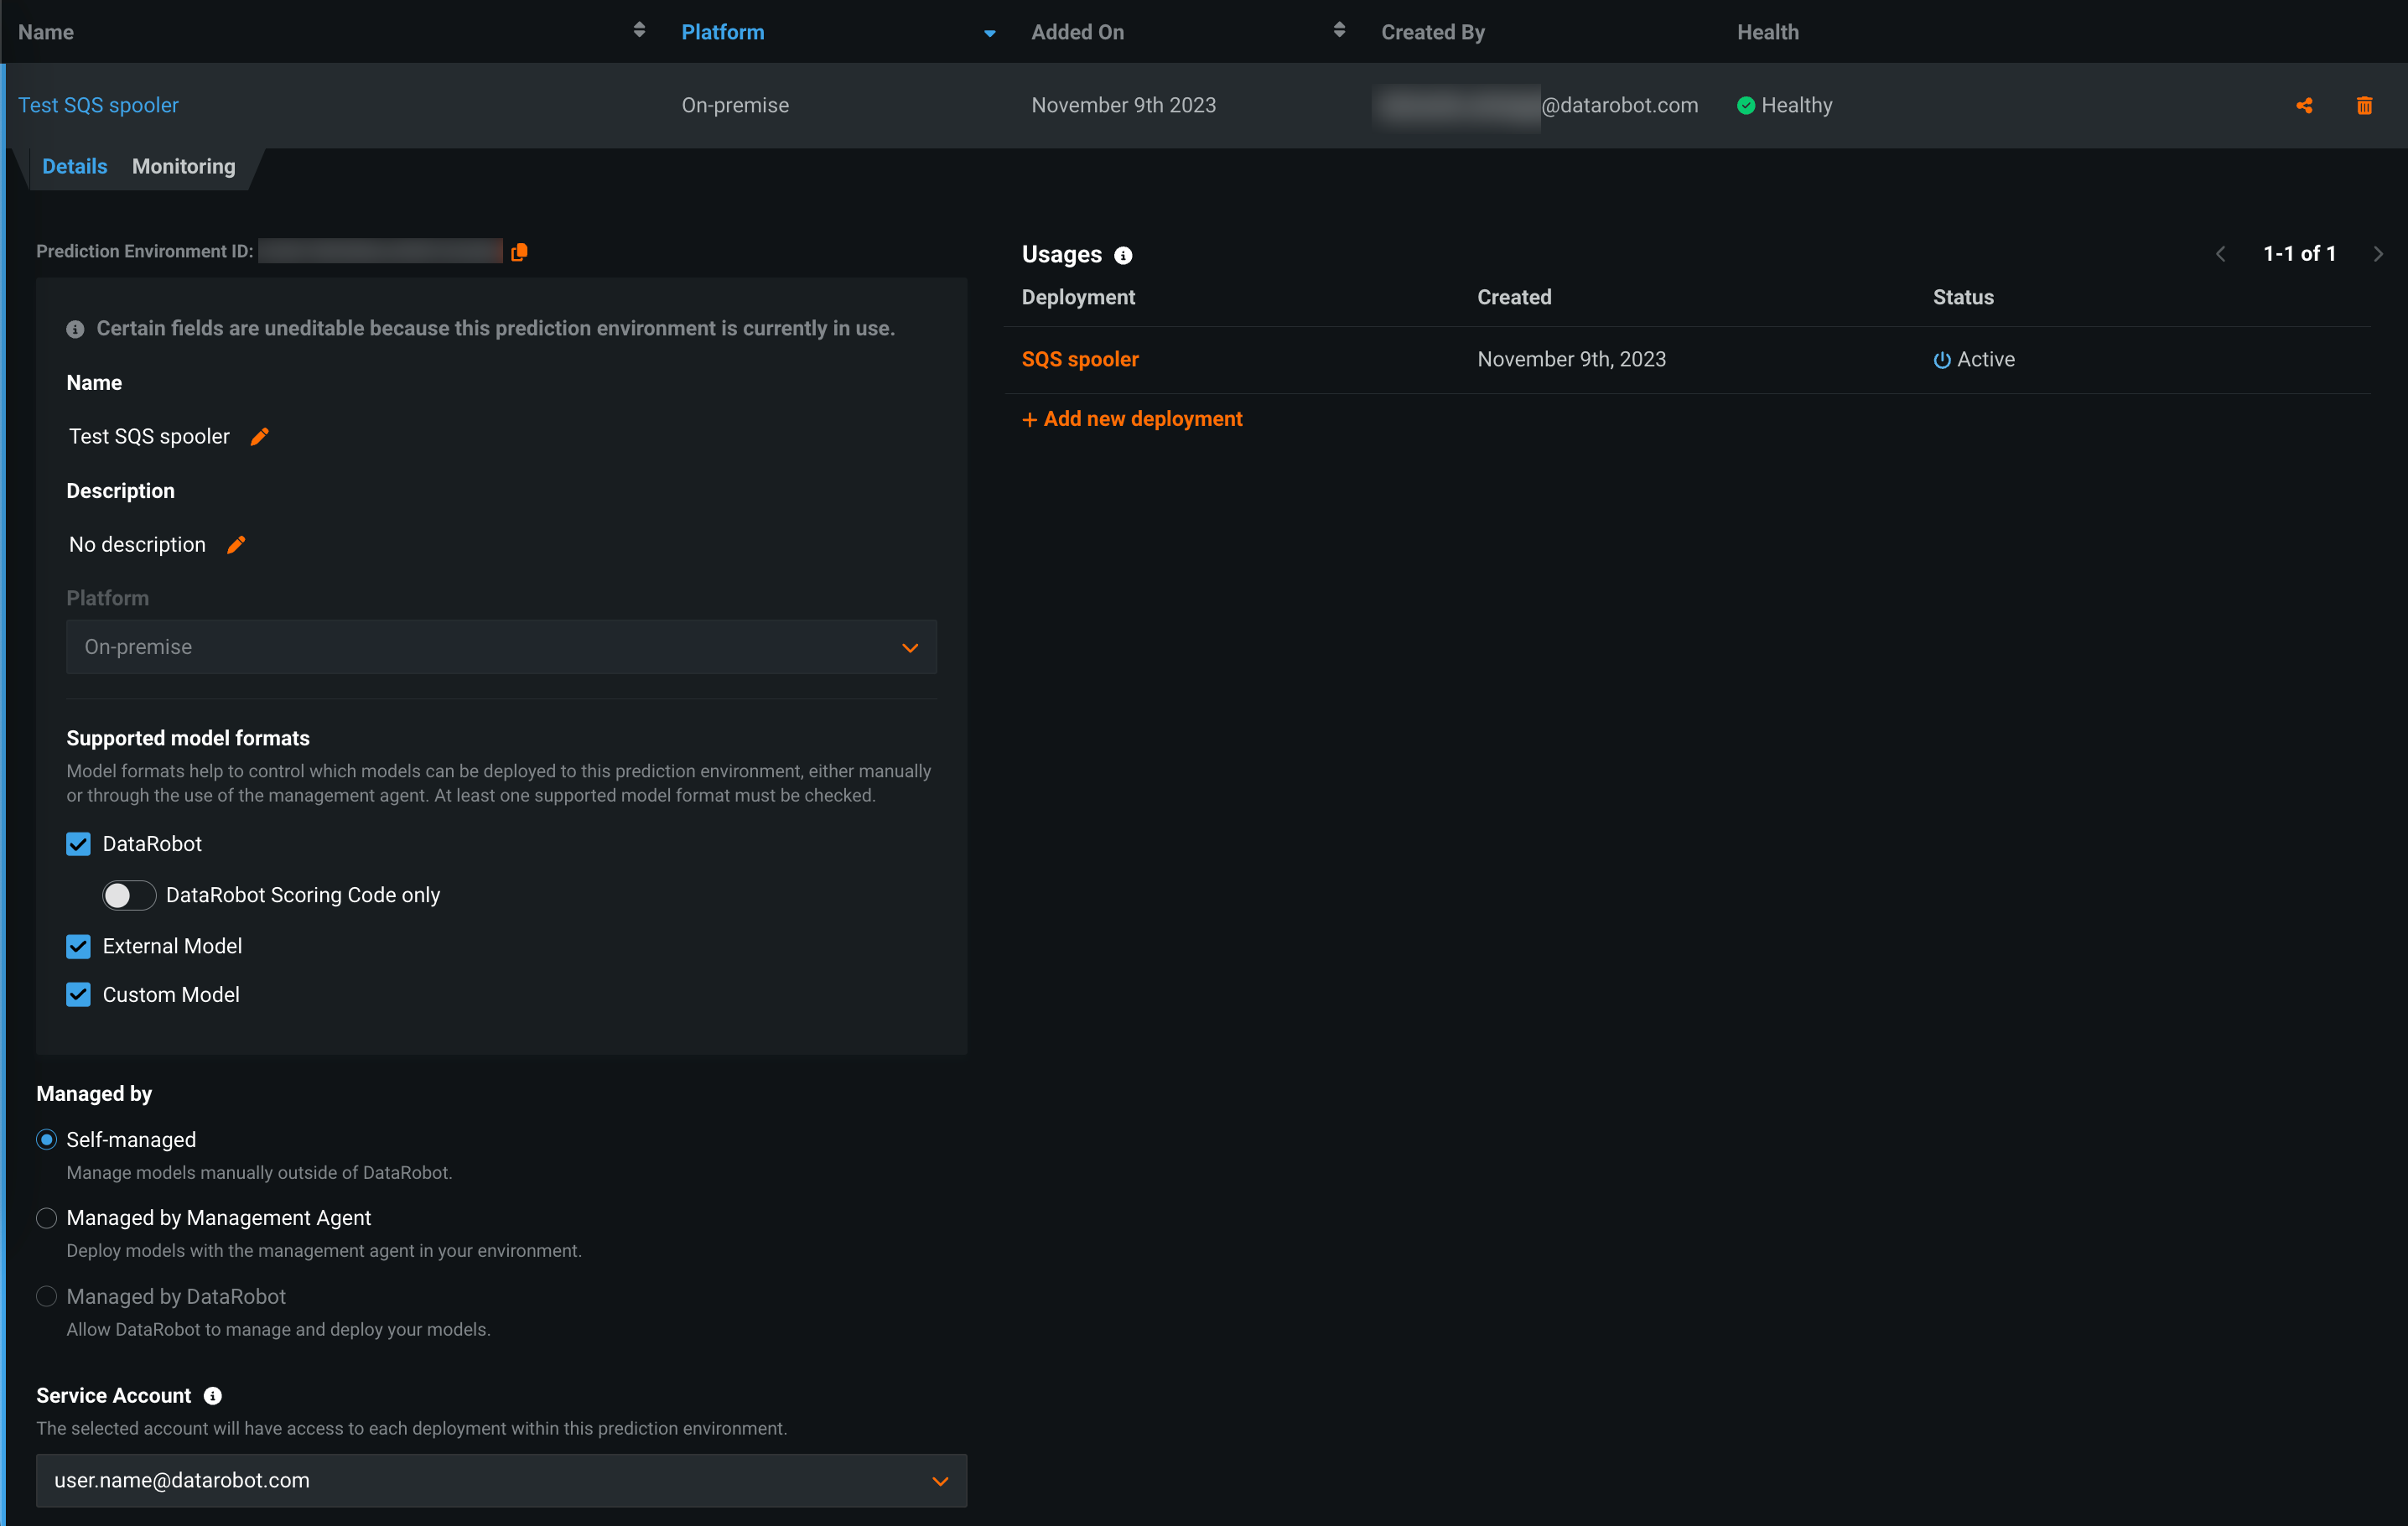
Deployment links
Deployment links are only provided for deployments you have access to.
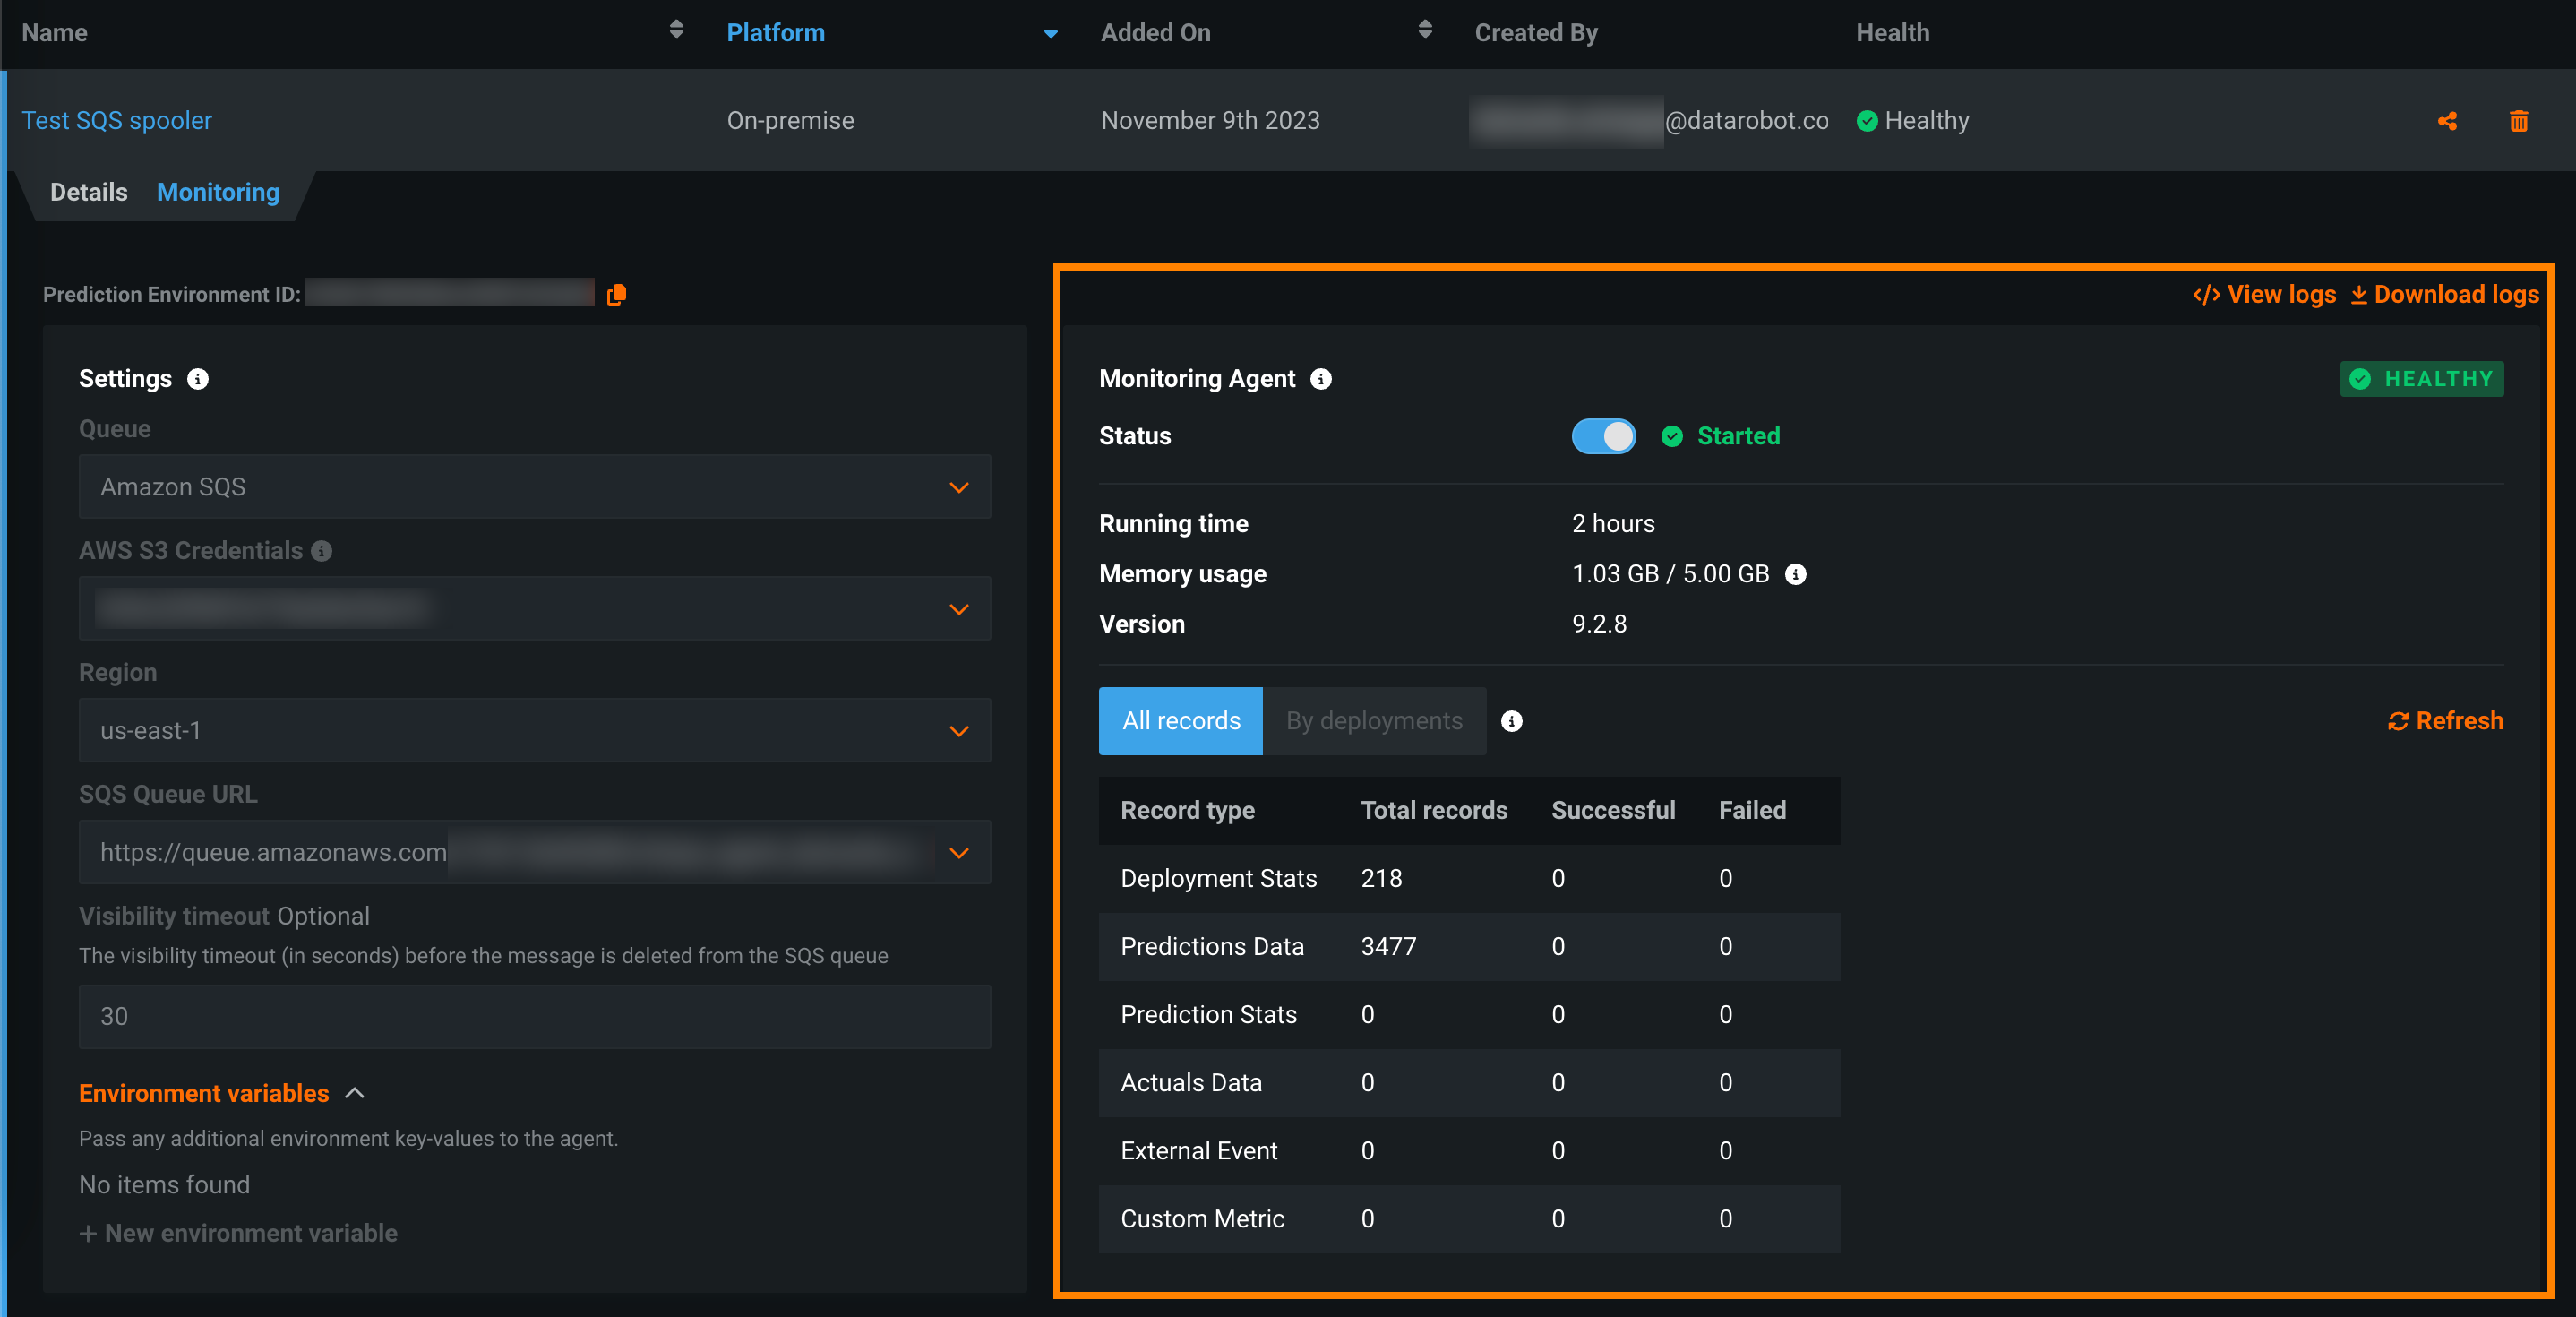
From the Monitoring tab, you can edit the Settings configured when creating the environment to modify the connection between the monitoring agent and the spooler. The agent Status must be inactive to edit these settings:
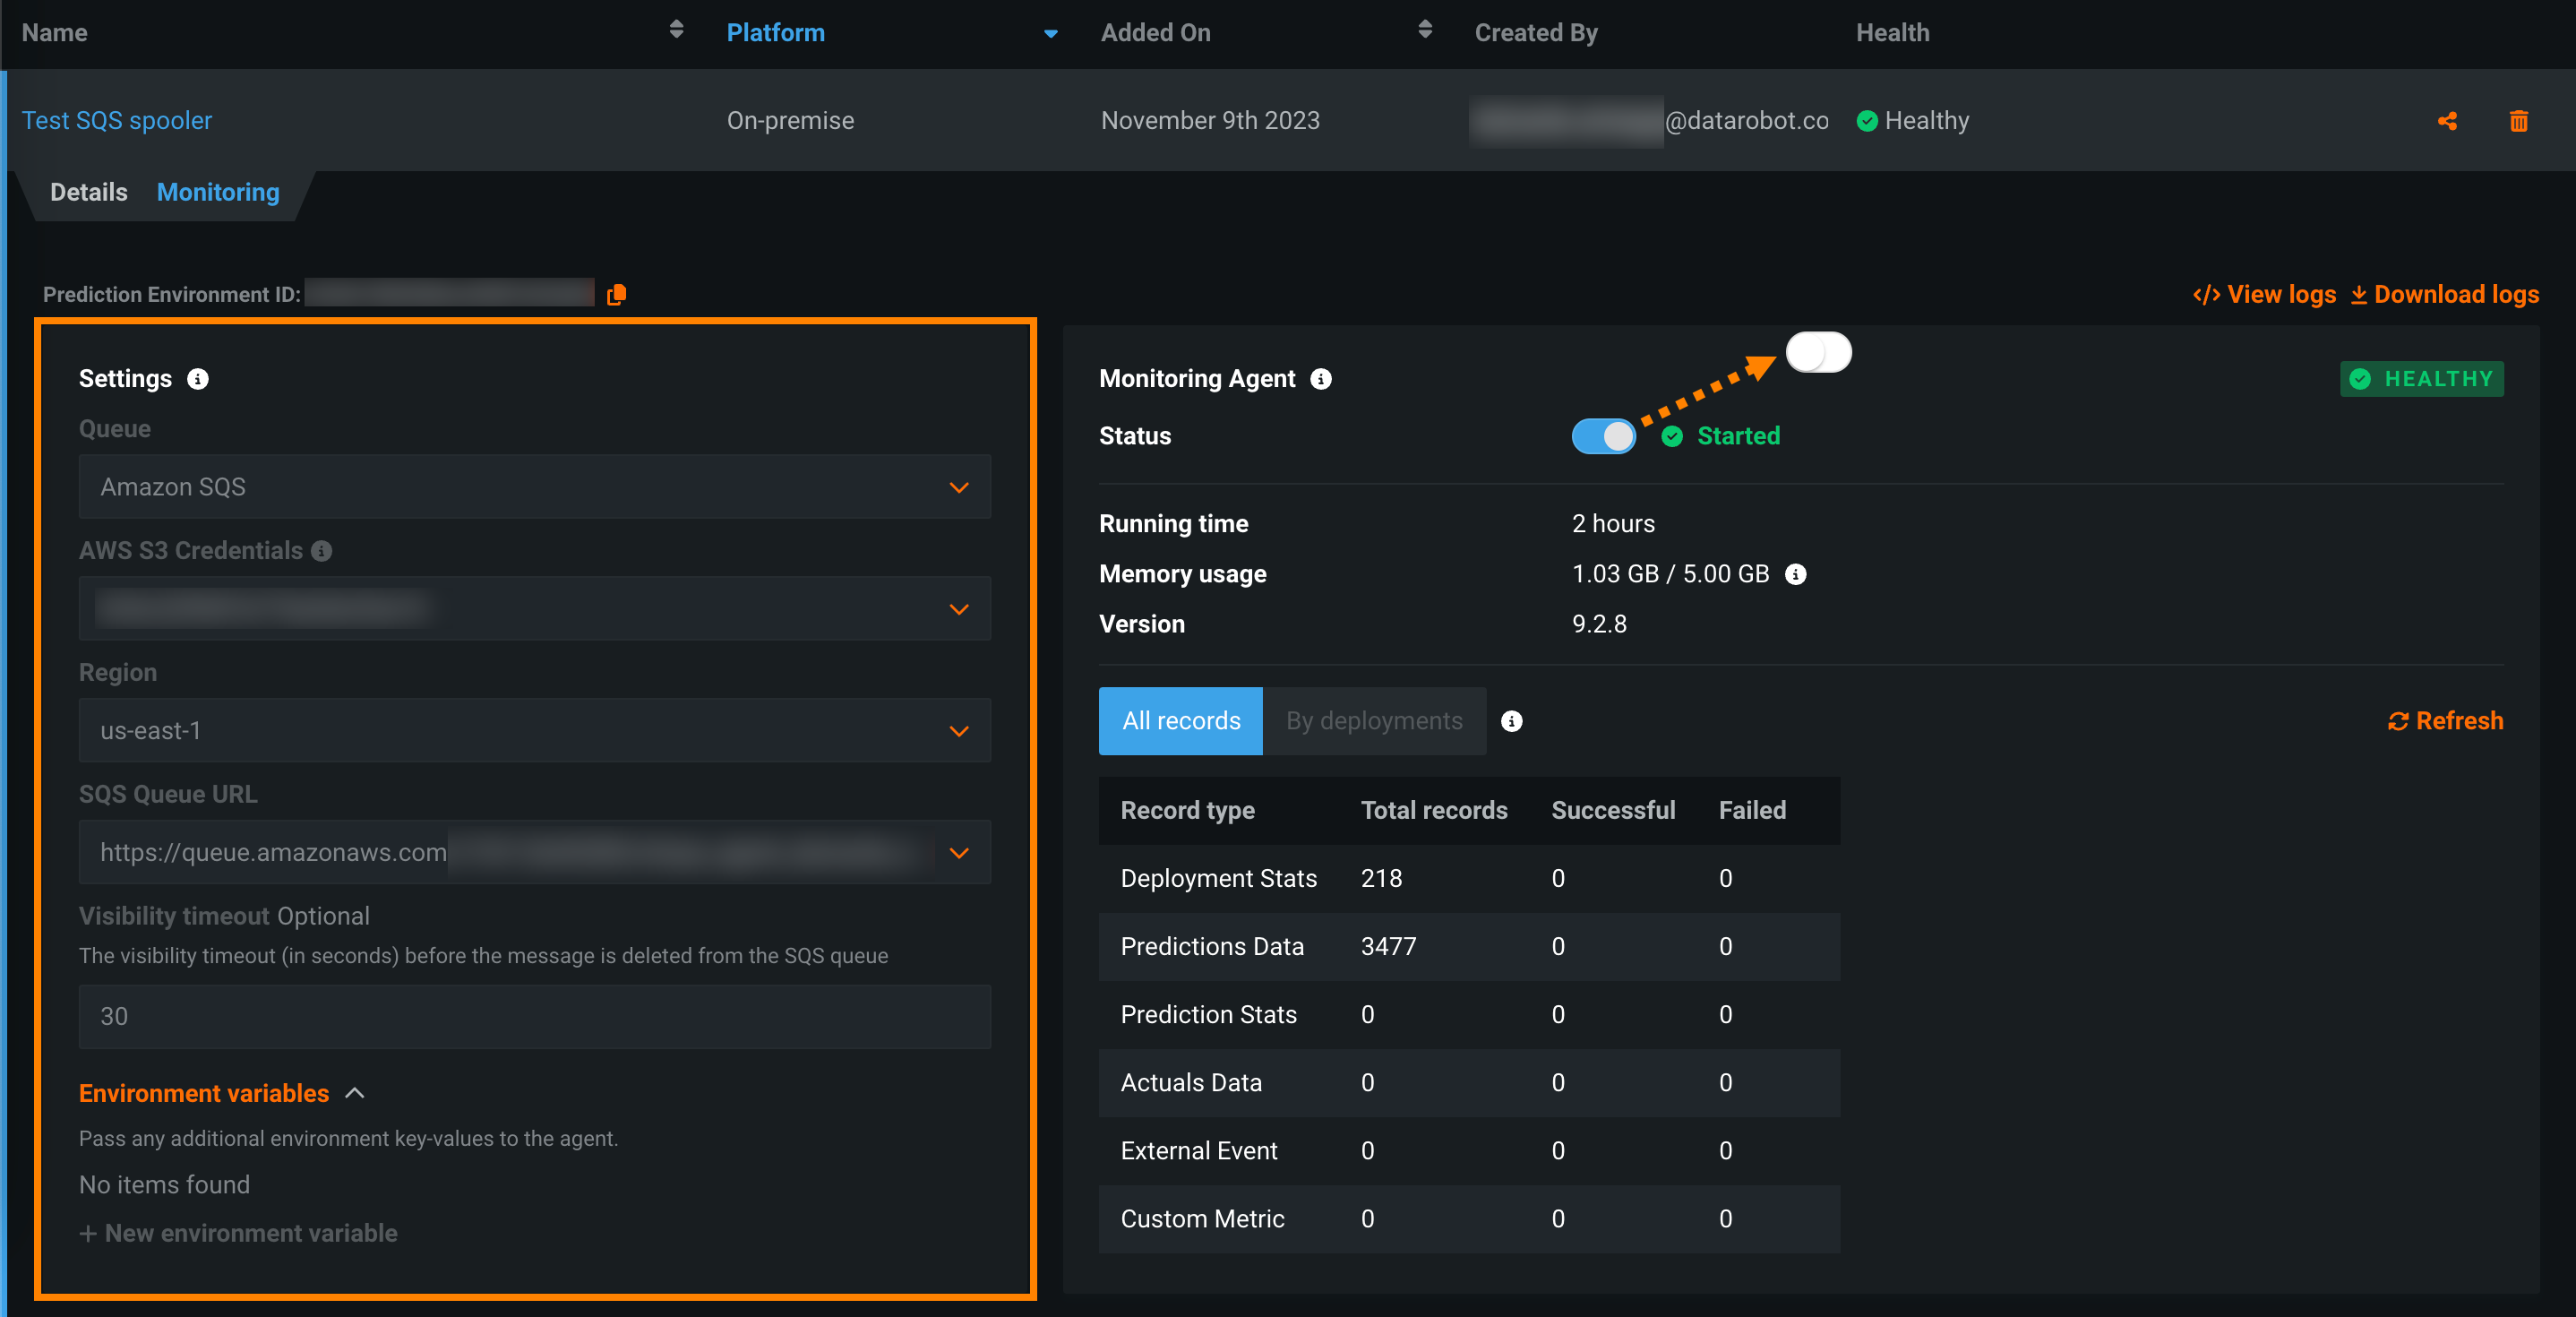
From the Monitoring Agent section, you can view agent status information, enable or disable the agent, view prediction records, and view or download logs: