Evaluate with model insights
Model insights help to interpret, explain, and validate what drives a model’s predictions. Using these tools can help to assess what to do in your next experiment. Available insights are dependent on experiment type, but may include the insights listed in the predictive modeling insights table below. To see a model's insights, click on the model in the left-pane Leaderboard. Note that different insights are available for time-aware experiments.
Available insights
| Insight | Description | Problem type | Sliced insights? |
|---|---|---|---|
| Blueprint | Provides a graphical representation of data preprocessing and parameter settings. | All | |
| Coefficients | Provides a visual indicator of the relative effects of the 30 most important variables. | All; linear models only | |
| Compliance documentation | Generates individualized documentation to provide comprehensive guidance on what constitutes effective model risk management. | ||
| Confusion matrix | Compares actual with predicted values in multiclass classification problems to identify class mislabeling. | Classification, time-aware | |
| Feature Effects | Conveys how changes to the value of each feature change model predictions | All | ✔ |
| Feature Impact | Shows which features are driving model decisions. | All | ✔ |
| Individual Prediction Explanations | Estimates how much each feature contributes to a given prediction, with values based on difference from the average. | Binary classification, regression | ✔ |
| Lift Chart | Depicts how well a model segments the target population and how capable it is of predicting the target. | All | ✔ |
| Model Iterations | Compares trained iterations in incremental learning experiments. | ||
| Residuals | Provides scatter plots and a histogram for understanding model predictive performance and validity. | Regression | ✔ |
| ROC Curve | Provides tools for exploring classification, performance, and statistics related to a model. | Binary classification | ✔ |
| Word Cloud | Visualize how text features influence model predictions. | Binary classification, regression |
Leaderboard views
There are two "flavors" of Leaderboard available.
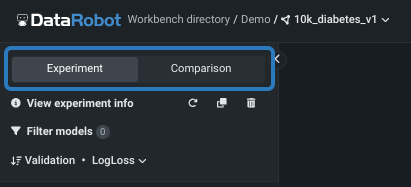
- This page describes the insights available from the Experiment tab, which helps to understand and evaluate models from a single experiment.
- See also the Comparison tab page, which allows you to compare up to three models of the same type (for example, binary or regression) from any number of experiments within a single Use Case. Access the comparison tool from the tab or the dropdown on the experiment name in the breadcrumbs.
What's next?
After selecting a model, you can, from within the experiment:
- Compare models.
- Add models to experiments.
- Make predictions.
- Create No-Code AI Apps.
- Generate a compliance report.
Updated April 23, 2024
Was this page helpful?
Great! Let us know what you found helpful.
What can we do to improve the content?
Thanks for your feedback!