Data exploration
On a deployment's Monitoring > Data exploration tab, you can interact with a deployment's stored data to gain insight into model performance and use that data to calculate custom metrics. The Data Exploration Summary includes the following functionality, depending on the deployment type:
Tab visibility
For Predictive AI deployments, the Data Exploration Summary page doesn't include sub-tabs. The tabs to switch between Data export and Data quality only appear in Generative AI deployments.
| Functionality | Description |
|---|---|
| Data export | For Predictive AI and Generative AI deployments, download a deployment's stored data including training data, prediction data, actuals, and custom metric data. |
| Data quality | For Generative AI deployments only, assess the quality of a Generative AI model's responses based on user feedback and custom metrics. |
Data requirements
To use the Data exploration tab, the deployment must store prediction data. Ensure that you enable prediction row storage in the data exploration (or challenger) settings. The Data exploration tab doesn't store or export Prediction Explanations, even if they are requested with the predictions.
Configure data exploration range
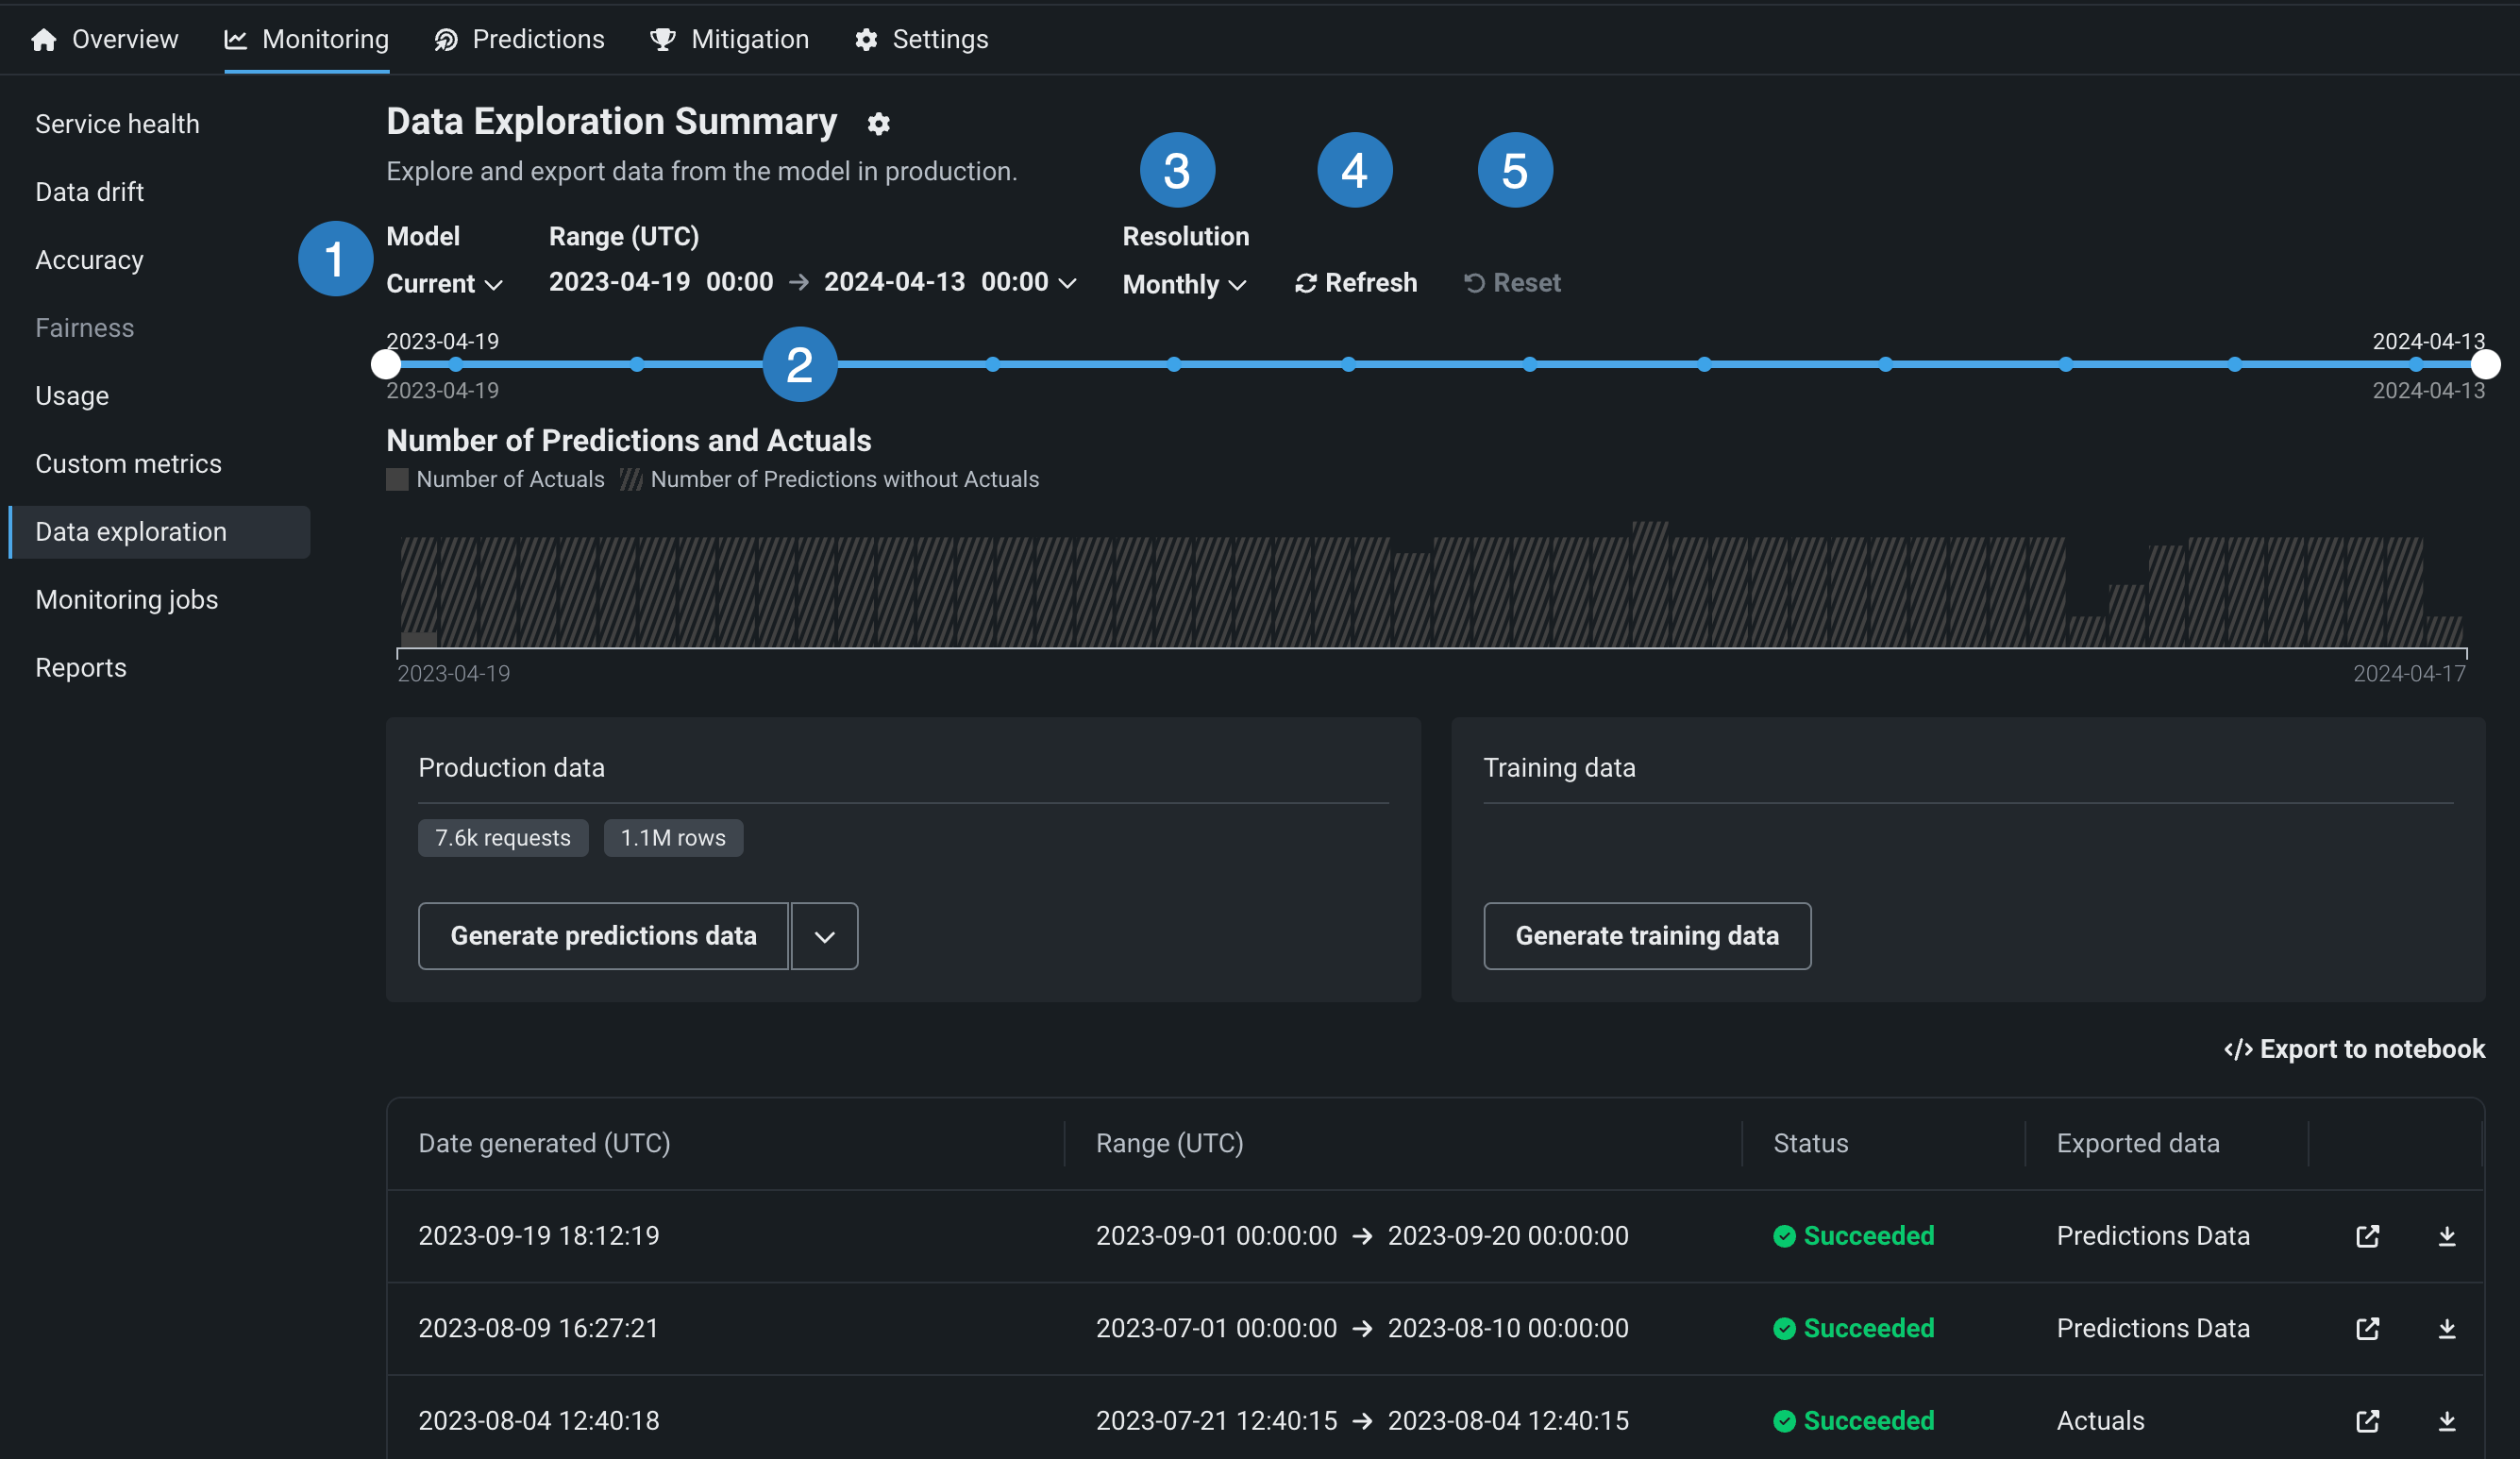
In the deployment from which you want to export stored training data, prediction data, or actuals, click the Monitoring > Data exploration tab and configure the following settings to specify the stored training data, prediction data, or actuals you want to export:
| Setting | Description | |
|---|---|---|
| 1 | Model | Select the deployment's model, current or previous, to export prediction data for. |
| 2 | Range (UTC) | Select the start and end dates of the period you want to export prediction data from. |
| 3 | Resolution | Select the granularity of the date slider. Select from hourly, daily, weekly, and monthly granularity based on the time range selected. If the time range is longer than 7 days, hourly granularity is not available. |
| 4 | Refresh | Refresh the data exploration tab's data. |
| 5 | Reset | Reset the data exploration settings to the default. |
Export deployment data
On the Data Exploration Summary (or, for Generative AI deployments, the Data export tab of the Data Exploration Summary), you can download a deployment's stored data. This can include training data, prediction data, actuals, and custom metric data. You can use the exported data to compute and monitor custom business or performance metrics on the Custom metrics tab or outside DataRobot. To export deployment data for custom metrics, verify that the deployment stores prediction data, generate data for a specified time range, and then view or download that data.
Export a deployment's production data
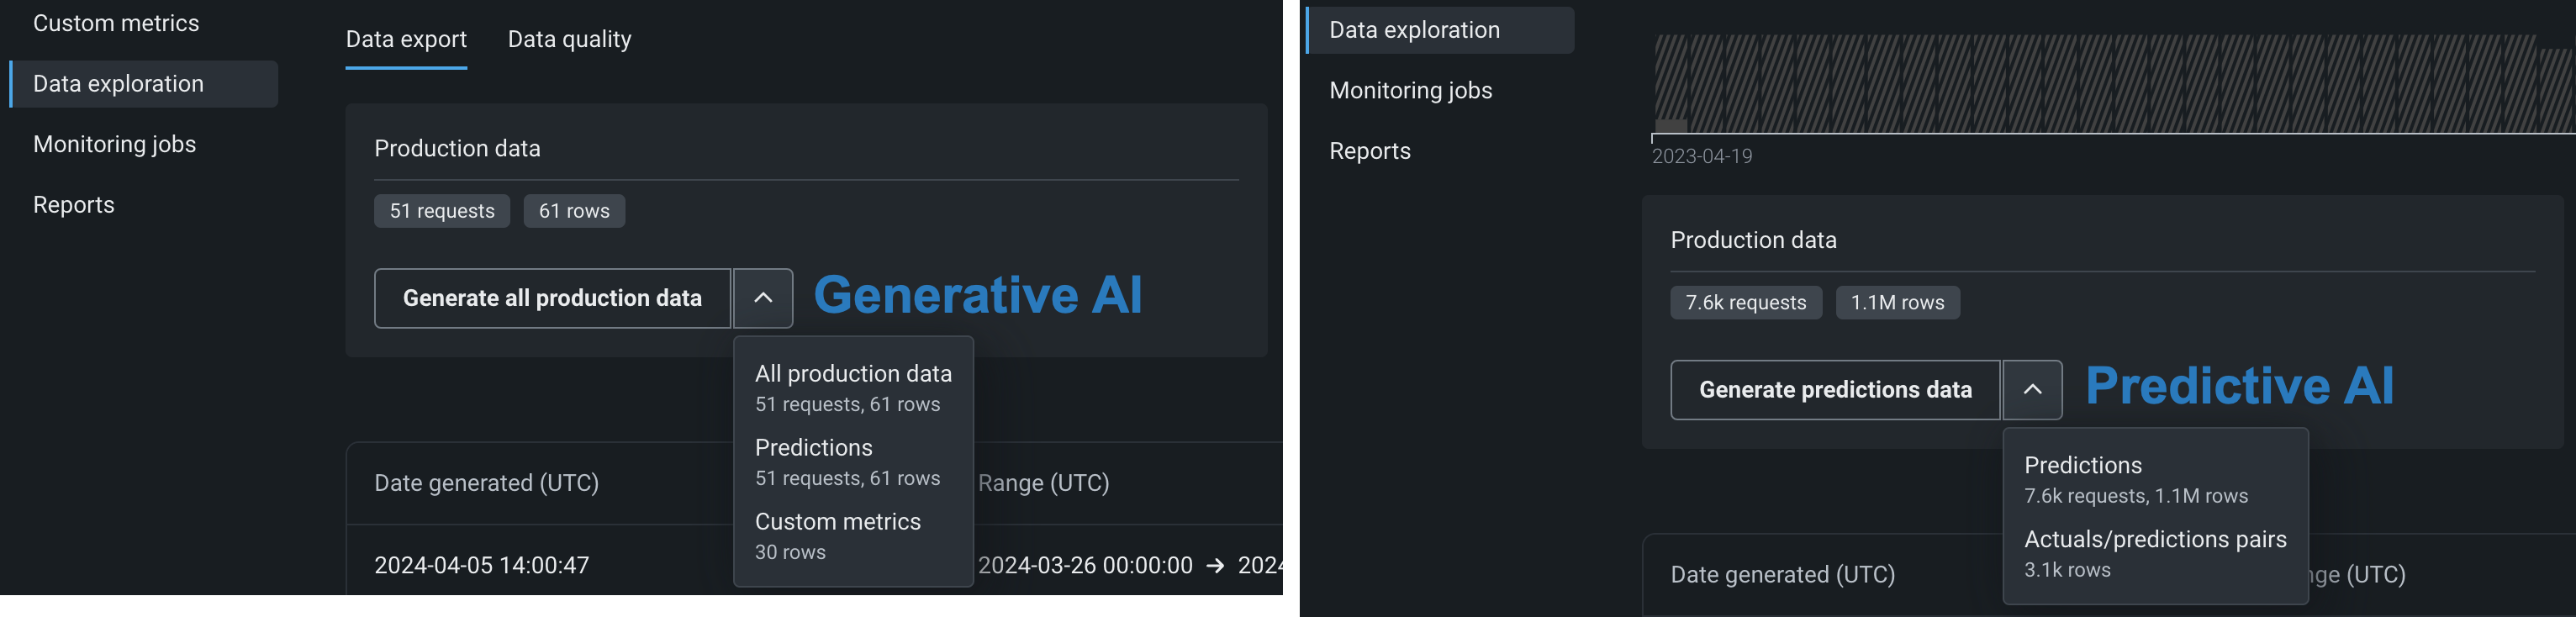
To access deployment data export for prediction data, actuals, or custom metric data, on the Data Exploration Summary page, locate the Production data panel. On the Production data panel, in the Generate button, click the down arrow and select one of the data generation options. The availability of the following options depends on the data stored in the deployment for the model and time range selected:
| Option | Description |
|---|---|
| All production data | For Generative AI deployments, generate all available production data (predictions, actuals, custom metrics) for the specified model and time range. |
| Predictions | Generate prediction data for the specified model and time range. |
| Actuals/predictions pairs | Generate actuals paired up with the related predictions for the specified model and time range. |
| Custom metrics | For Generative AI deployments, generate available custom metric data for the specified model and time range. |
Availability info
Custom metric data export is off by default. Contact your DataRobot representative or administrator for information on enabling this feature.
Feature flag: Enable Data Quality Table for Text Generation Target Types, Enable Actuals Storage for Generative Models (Premium feature)
Production data appears in the table below the panels. You can identify the data type in the Exported data column.
Prediction data and actuals considerations
When generating prediction data or actuals, consider the following:
-
When generating prediction data, you can export up to 200,000 rows per export. If the time range you set exceeds 200,000 rows of prediction data, decrease the range.
-
In the Data Registry, you can have up to 100 prediction export items. If generating prediction data for export would cause the number of prediction export items in the Data Registry to exceed that limit, delete old prediction export Data Registry items.
-
When generating prediction data for time series deployments, two prediction export items are added to the Data Registry. One item is for the prediction data, and the other is for the prediction results. The Data exploration tab links to the prediction results.
-
When generating actuals, you can export up to 1,000,000 rows per export. If the time range you set exceeds 1,000,000 rows of actuals, decrease the time range.
-
In the Data Registry, you can have up to 100 actuals export items. If generating actuals data for export would cause the number of actuals export items in the Data Registry to exceed that limit, delete old actuals export Data Registry items.
-
Up to 10,000,000 actuals are stored for a deployment; therefore, exporting old actuals can result in an error if no actuals are currently stored for that time period.
Export a deployment's training data
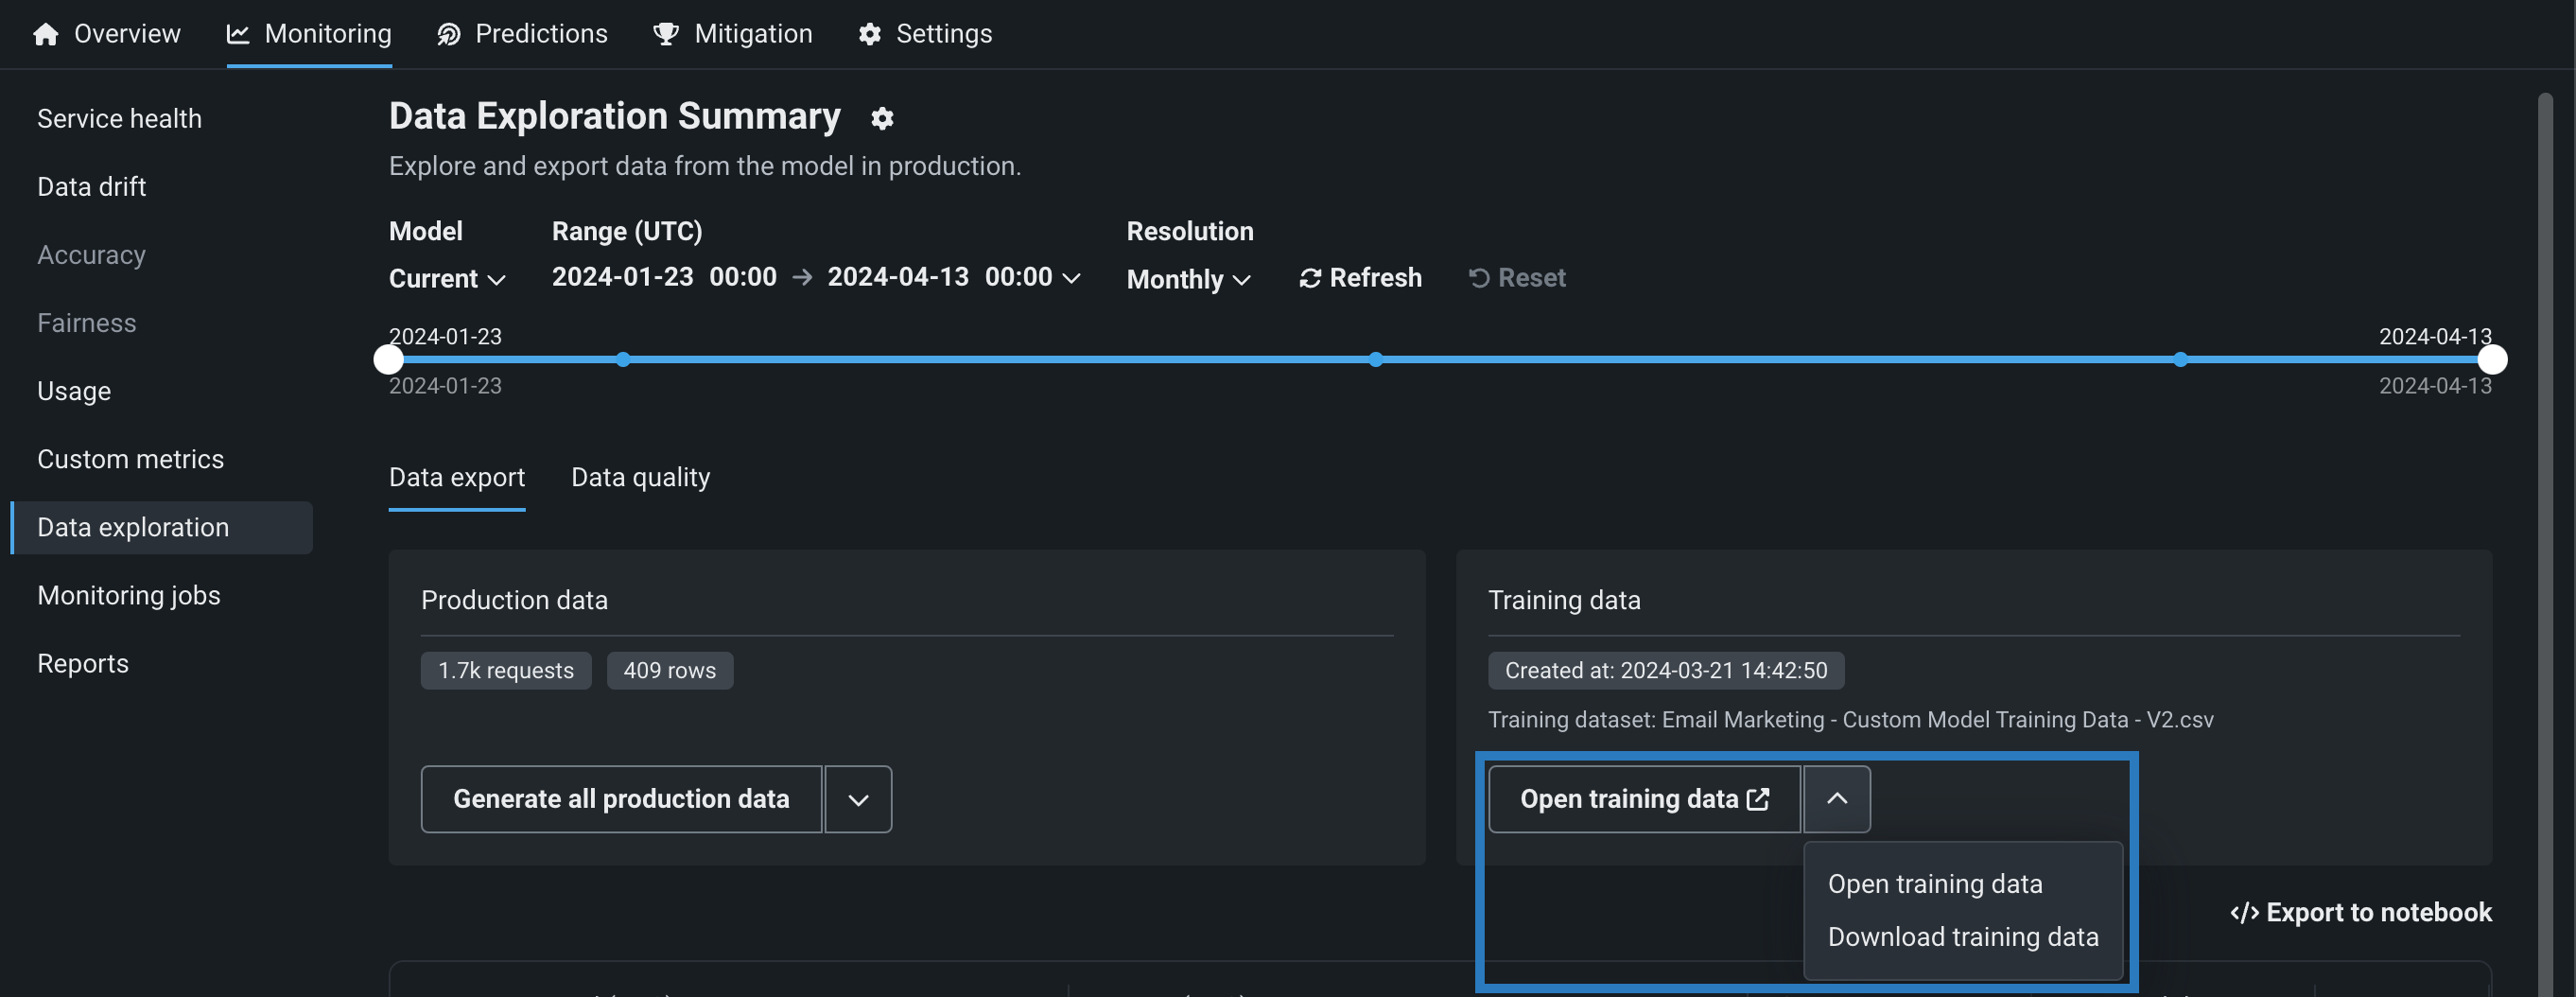
To access deployment data export for training data, on the Data Exploration Summary page, locate the Training data panel and click Generate training data to generate data for the specified model and time range:
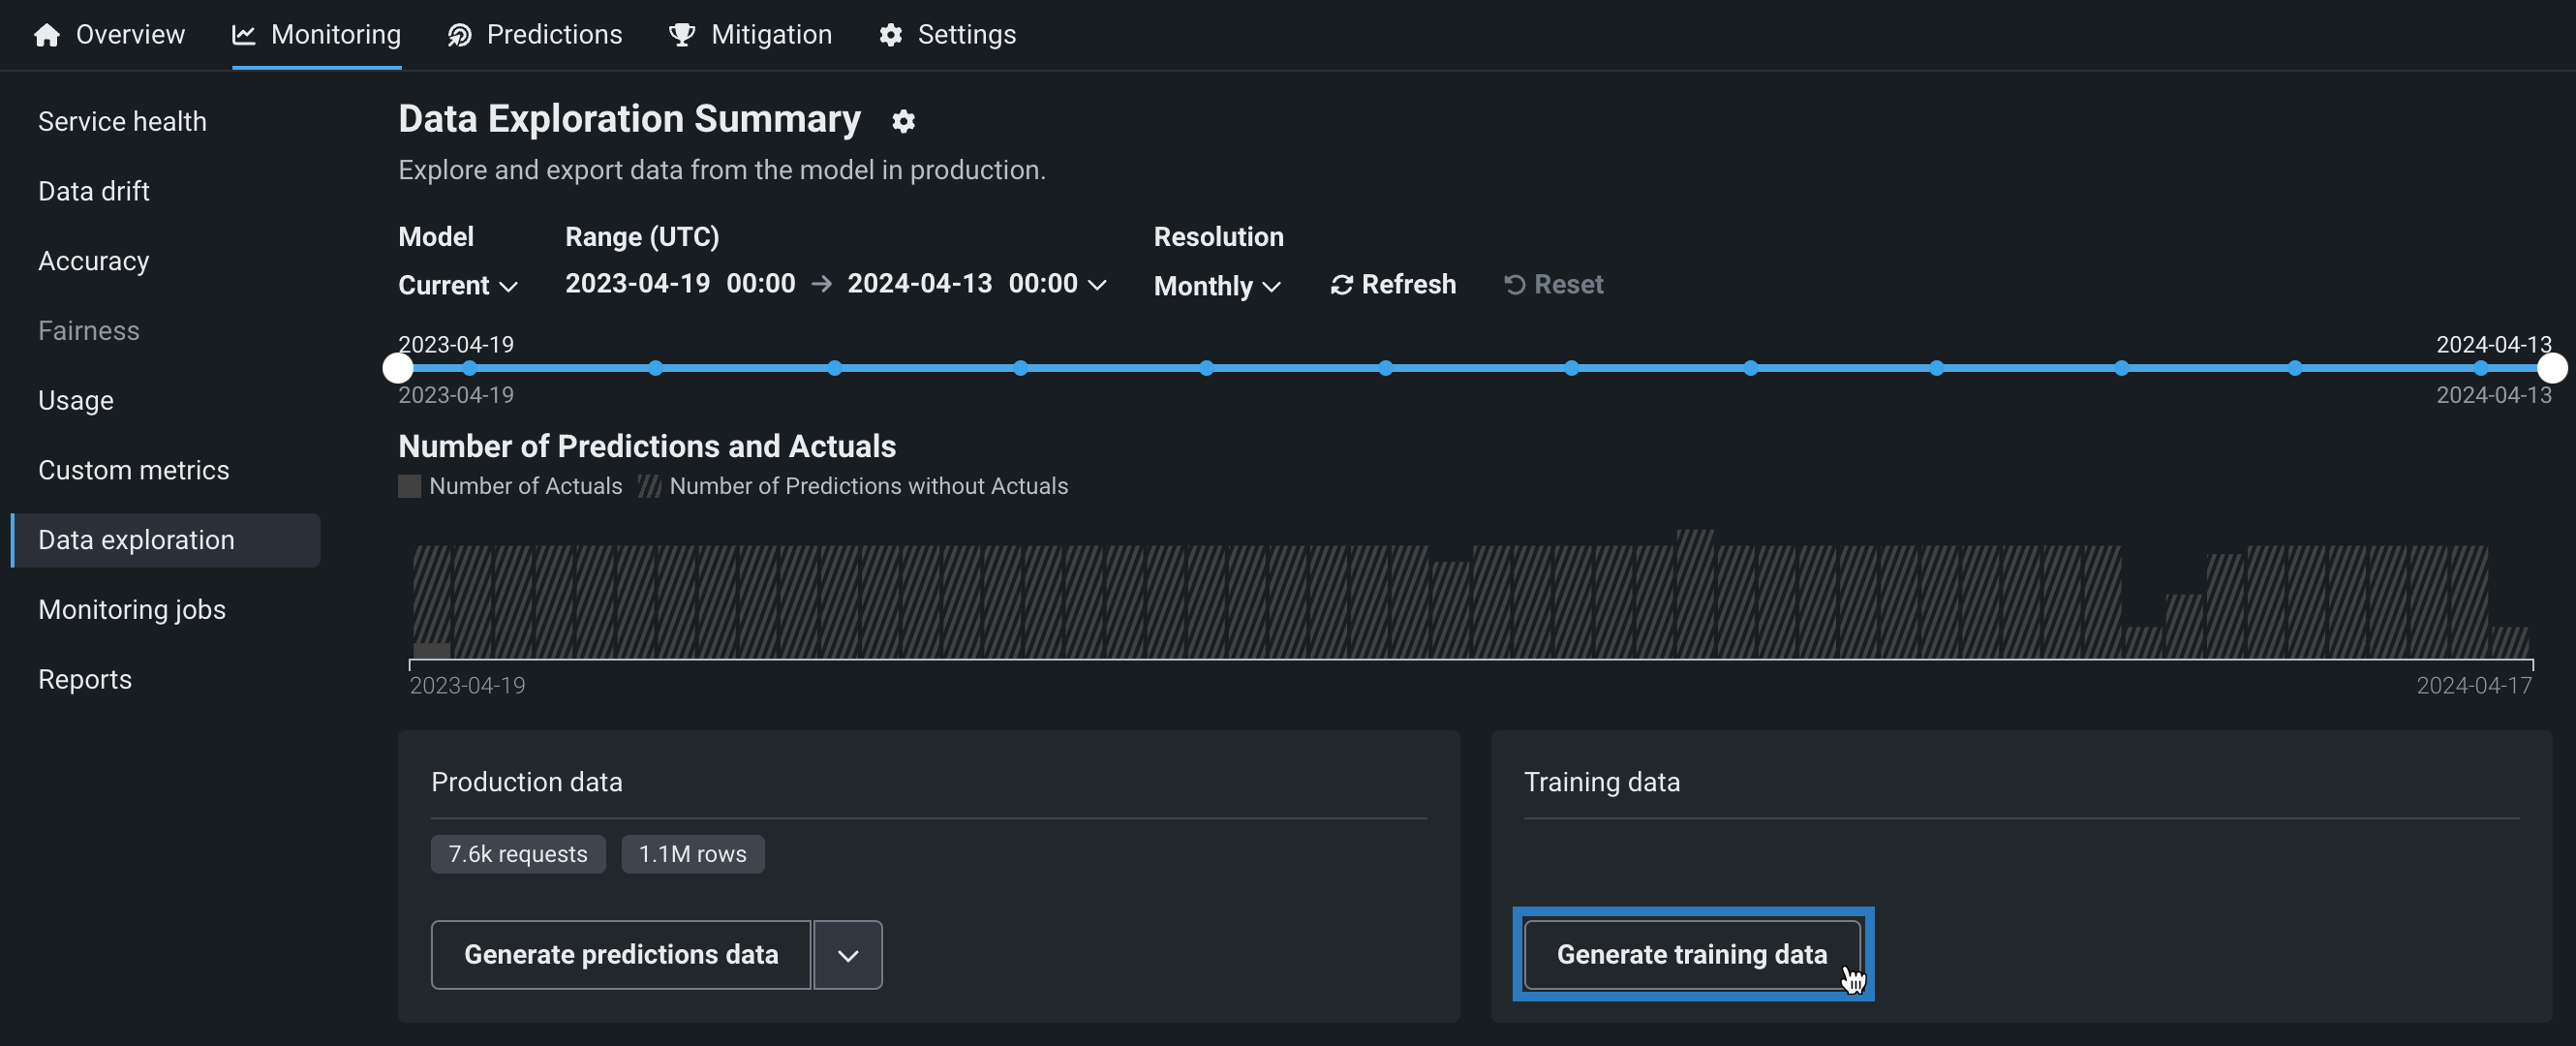
The training data appears in the Training Data panel. Click the down arrow to choose between Open training data and Download training data :
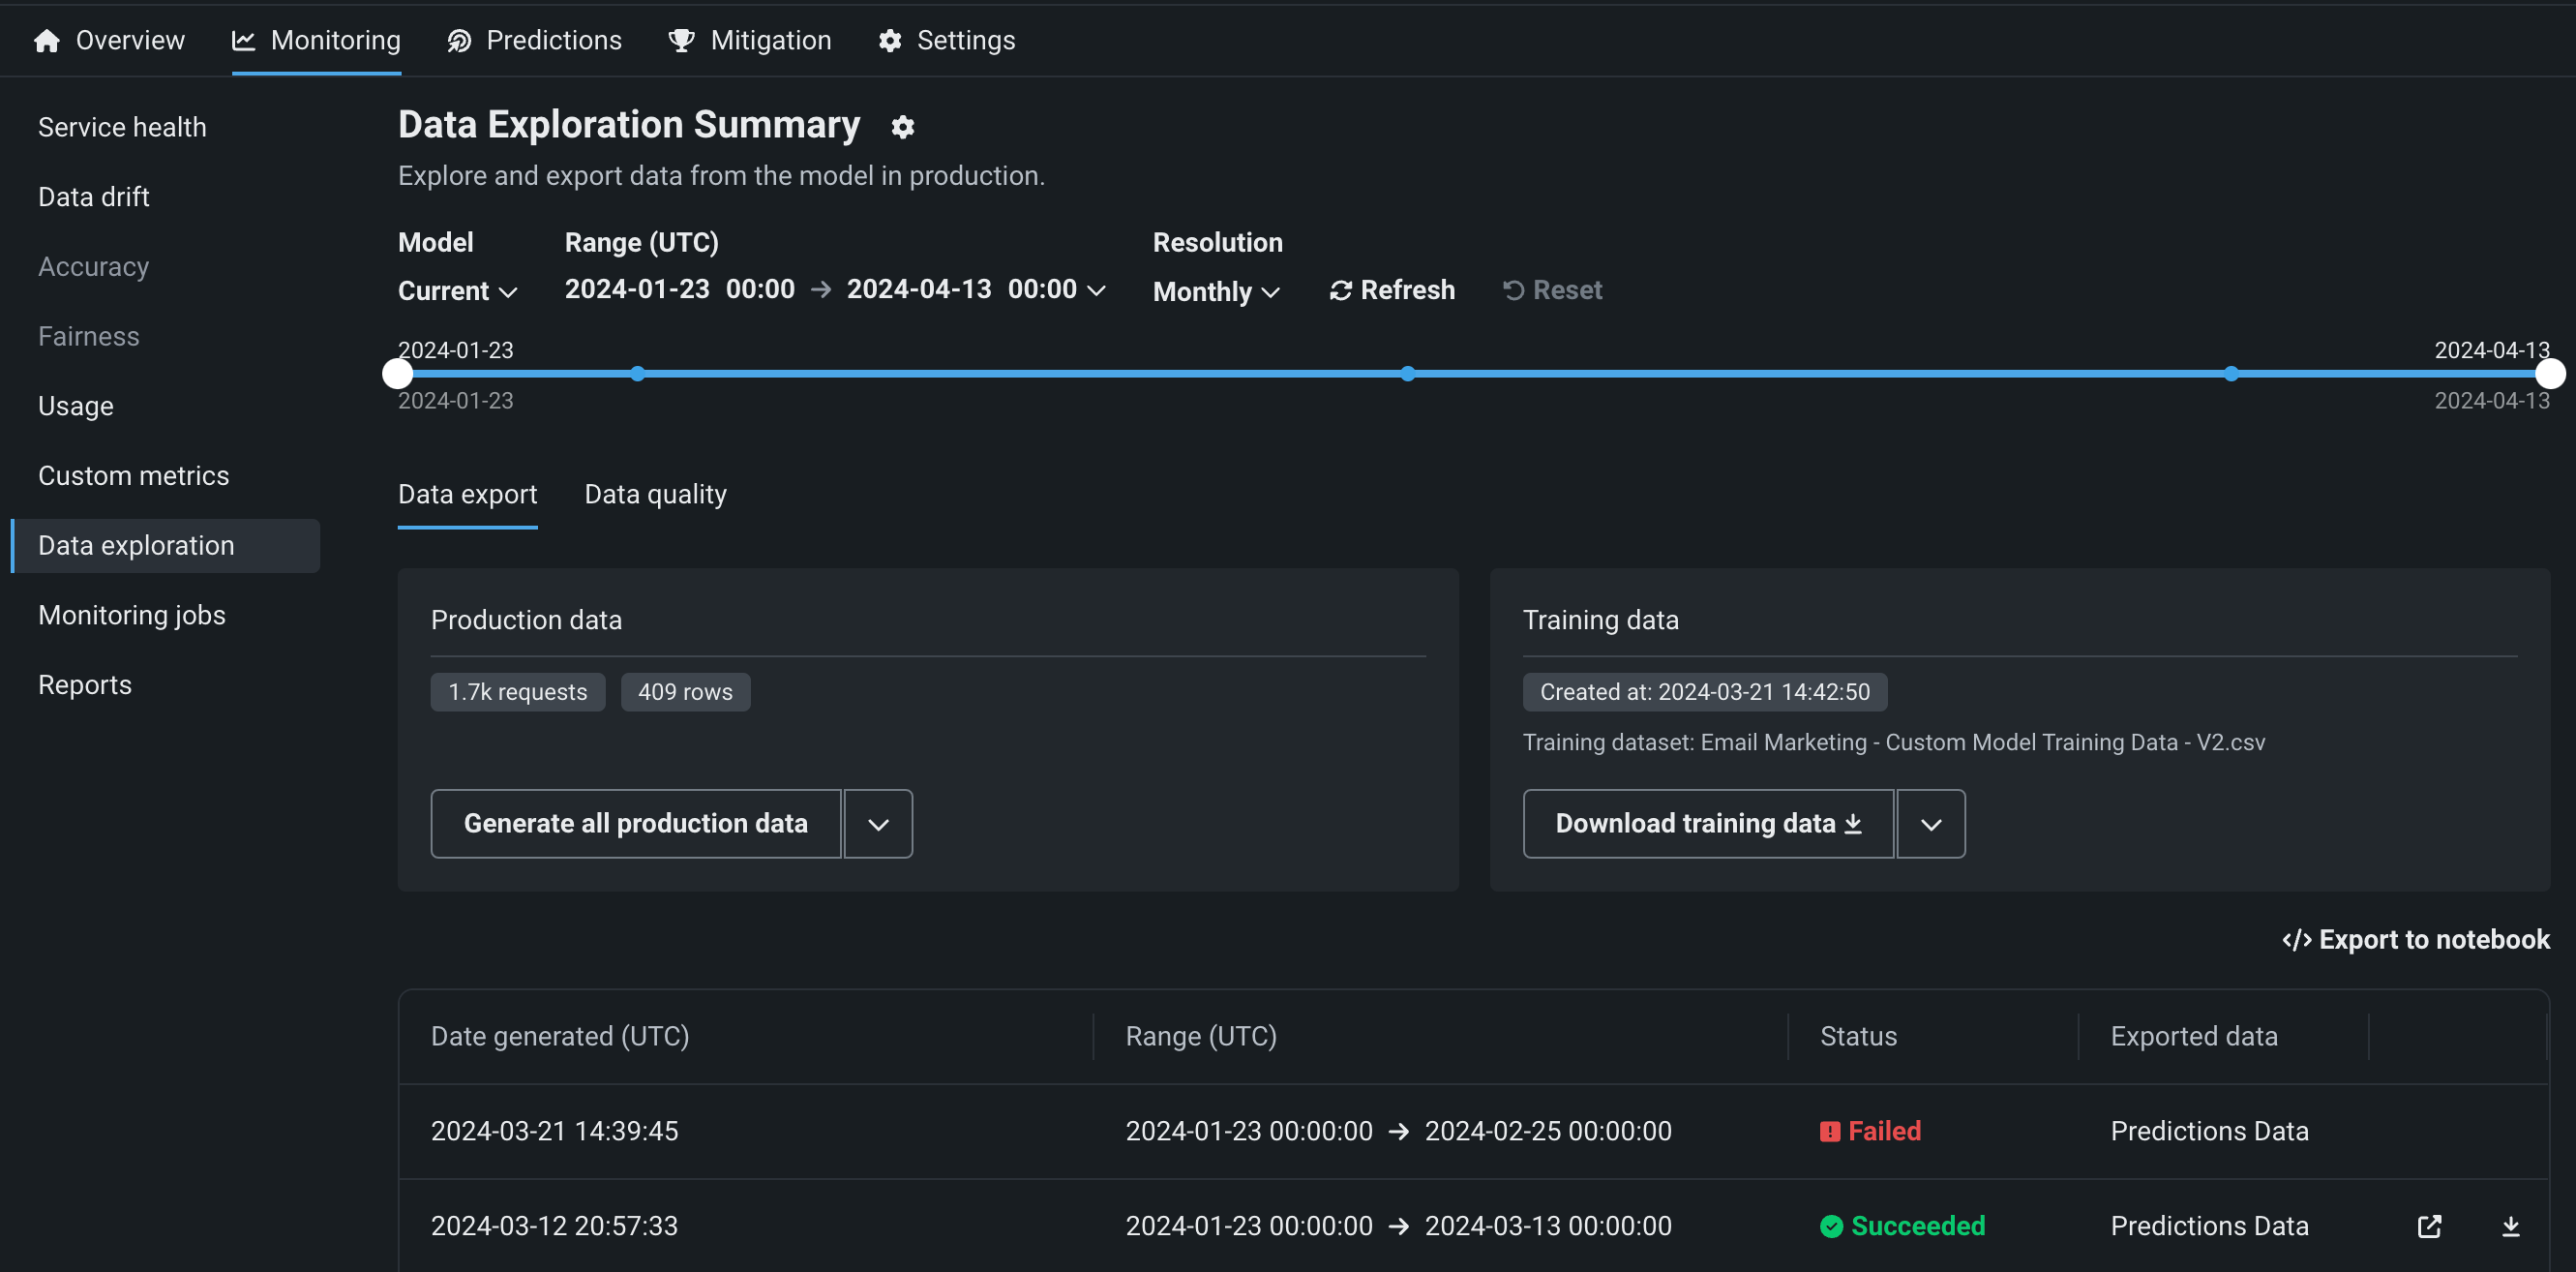
Review and download data
After the production or training data are generated, you can view or download the data. Production data appears in the table below the panels, where you can identify the data type in the Exported data column. Training data appears in the Training data panel.
| Option | Description |
|---|---|
| Open the prediction data in the Data Registry. | |
| Download the prediction data. |
Note
You can also click Export to notebook to open a DataRobot notebook with cells for exporting training data, prediction data, and actuals.
Use exported deployment data for custom metrics
To use the exported deployment data to create your own custom metrics, you can implement a script to read from the CSV file containing the exported data and then calculate metrics using the resulting values, including columns automatically generated during the export process.
This example uses the exported prediction data to calculate and plot the change in the time_in_hospital feature over a 30-day period using the DataRobot prediction timestamp (DR_RESERVED_PREDICTION_TIMESTAMP) as the DateFrame index (or row labels). It also uses the exported training data as the plot's baseline:
import pandas as pd
feature_name = "<numeric_feature_name>"
training_df = pd.read_csv("<path_to_training_data_csv>")
baseline = training_df[feature_name].mean()
prediction_df = pd.read_csv("<path_to_prediction_data_csv>")
prediction_df["DR_RESERVED_PREDICTION_TIMESTAMP"] = pd.to_datetime(
    prediction_df["DR_RESERVED_PREDICTION_TIMESTAMP"]
)
predictions = prediction_df.set_index("DR_RESERVED_PREDICTION_TIMESTAMP")["time_in_hospital"]
ax = predictions.rolling('30D').mean().plot()
ax.axhline(y=baseline - 2, color="C1", label="training data baseline")
ax.legend()
ax.figure.savefig("feature_over_time.png")
DataRobot column reference
DataRobot automatically adds the following columns to the prediction data generated for export:
| Column | Description |
|---|---|
DR_RESERVED_PREDICTION_TIMESTAMP |
Contains the prediction timestamp. |
DR_RESERVED_PREDICTION |
Identifies regression prediction values. |
DR_RESERVED_PREDICTION_<Label> |
Identifies classification prediction values. |
Explore deployment data quality
Availability info
Data quality analysis is off by default. Contact your DataRobot representative or administrator for information on enabling this feature.
Feature flag: Enable Data Quality Table for Text Generation Target Types, Enable Actuals Storage for Generative Models (Premium feature)
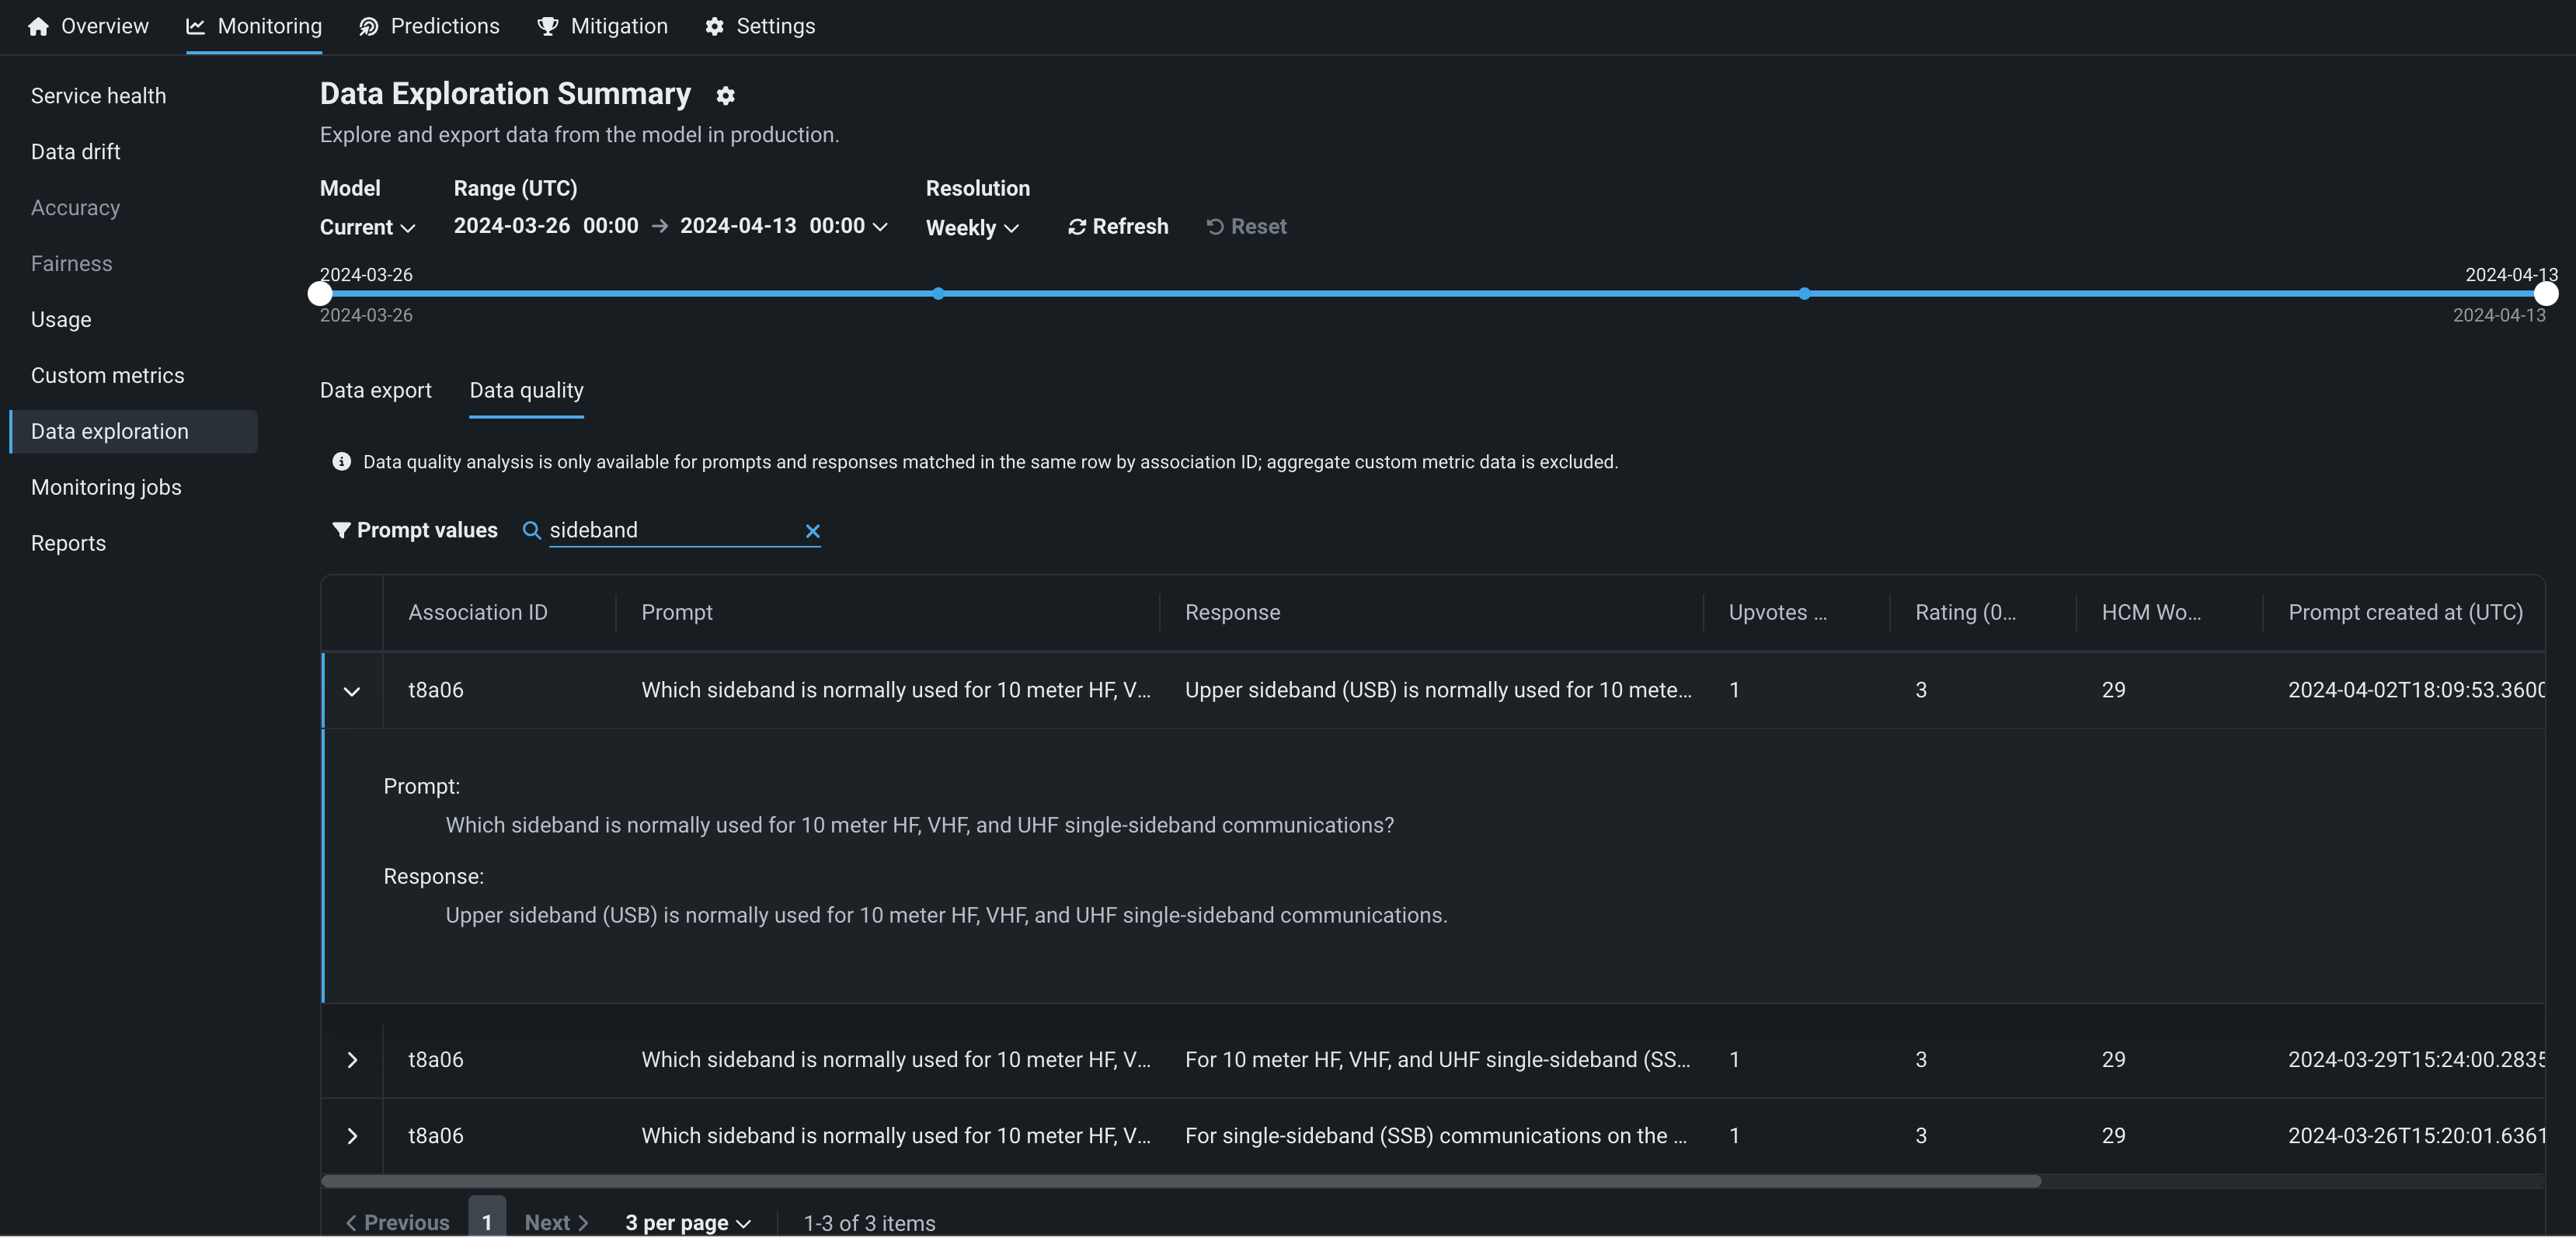
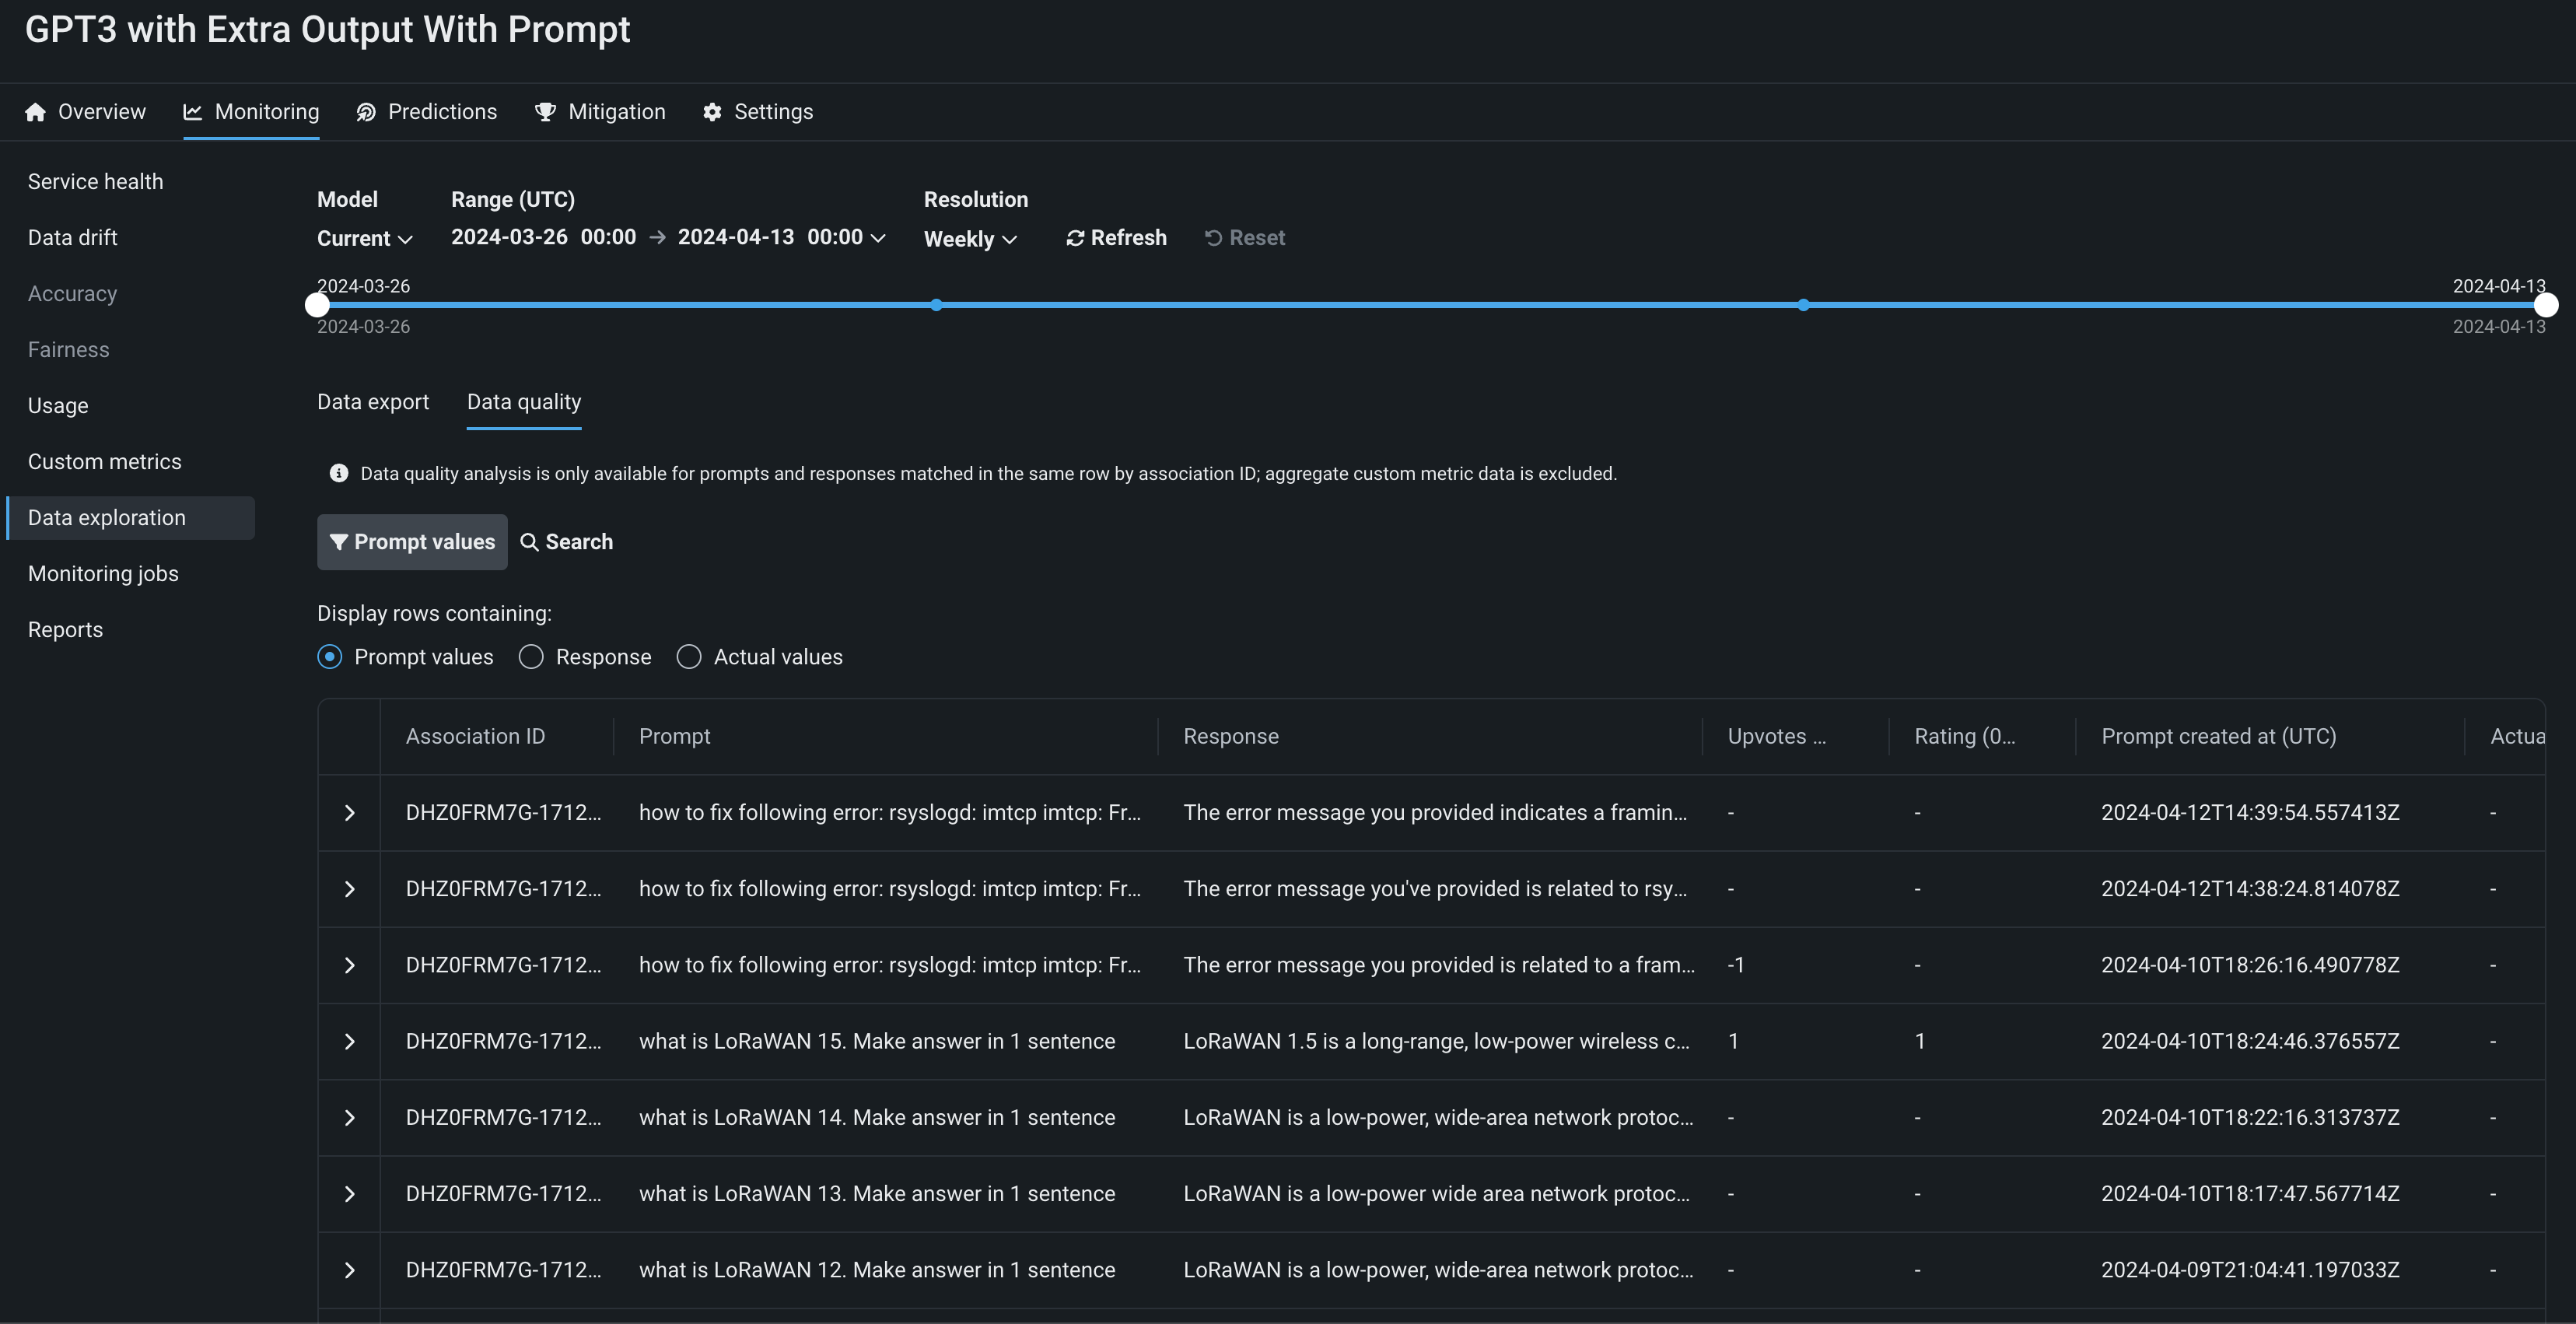
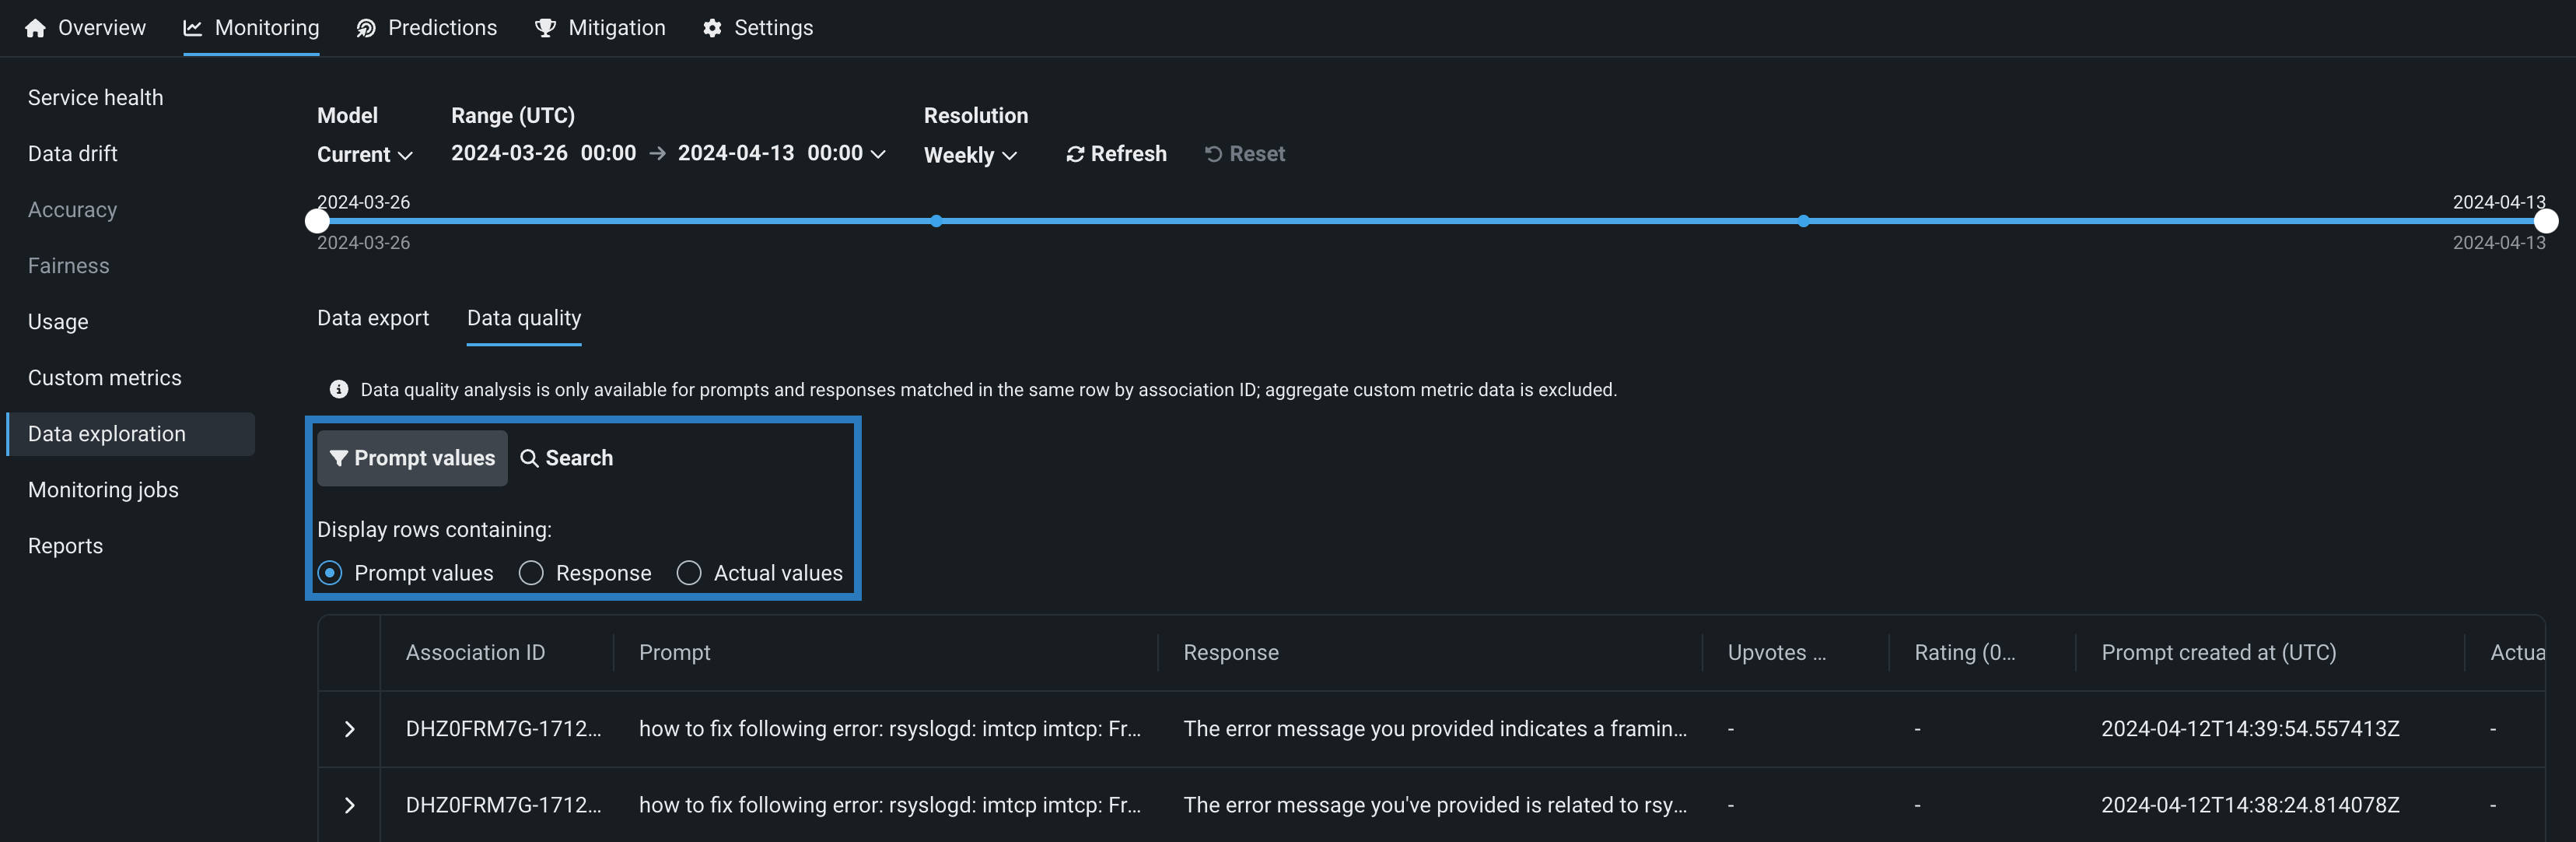
On the Data exploration tab of a Generative AI deployment, click Data quality to explore prompts, responses, user ratings, and custom metrics matched by association ID. This view provides insight into the quality of the Generative AI model's responses, as rated by users and based on any Generative AI custom metrics you implement:
Prompt and response matching
To use the data quality table, define an association ID to match prompts with responses in the same row. Data quality analysis is only available for prompts and responses matched in the same row by association ID; aggregate custom metric data is excluded.
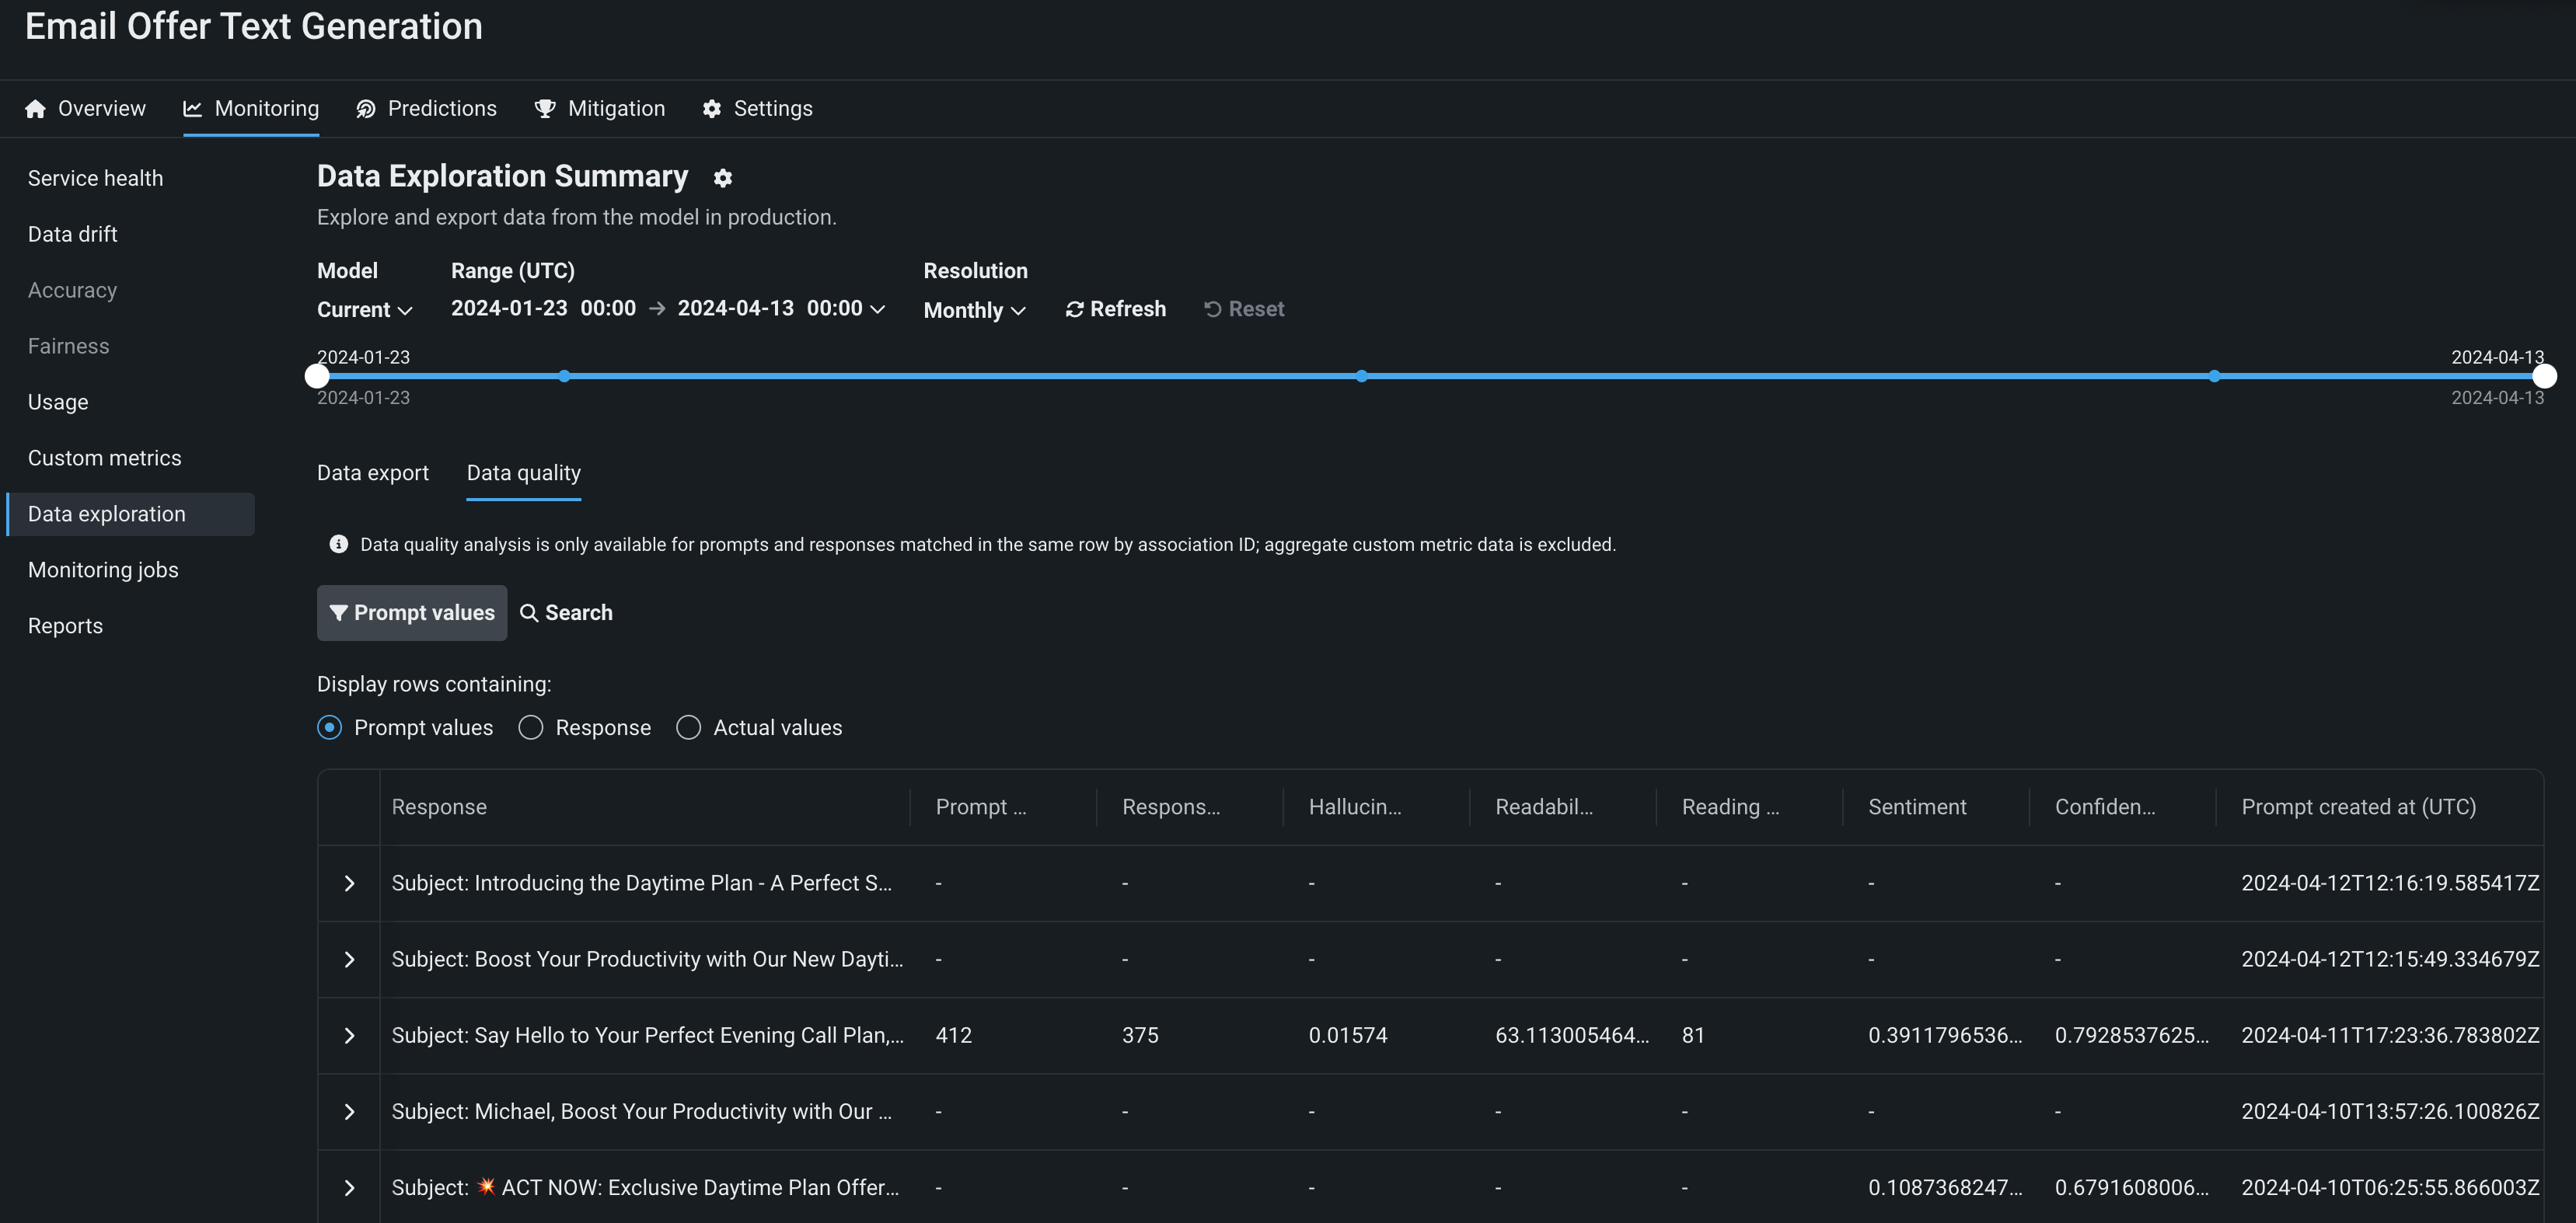
Locate specific rows by filtering the table to only display rows containing Prompt values, Response values, or Actual values. Click Search to locate a specific row in the Data quality table by prompt:
Click the open icon to expand the details panel, displaying a row's full Prompt and the Response matched with the prompt by association ID: