Series Insights (clustering)
The Series Insights tab for time series clustering provides series clustering information, including the cluster to which the series belongs, as well as series row and date information. Histograms, a non-clustering version of Series Insights for multiseries projects, are also available. The insight is helpful in identifying which cluster any given series was assigned to, and also provides an at-a-glance check that no single series is inappropriately dominant.
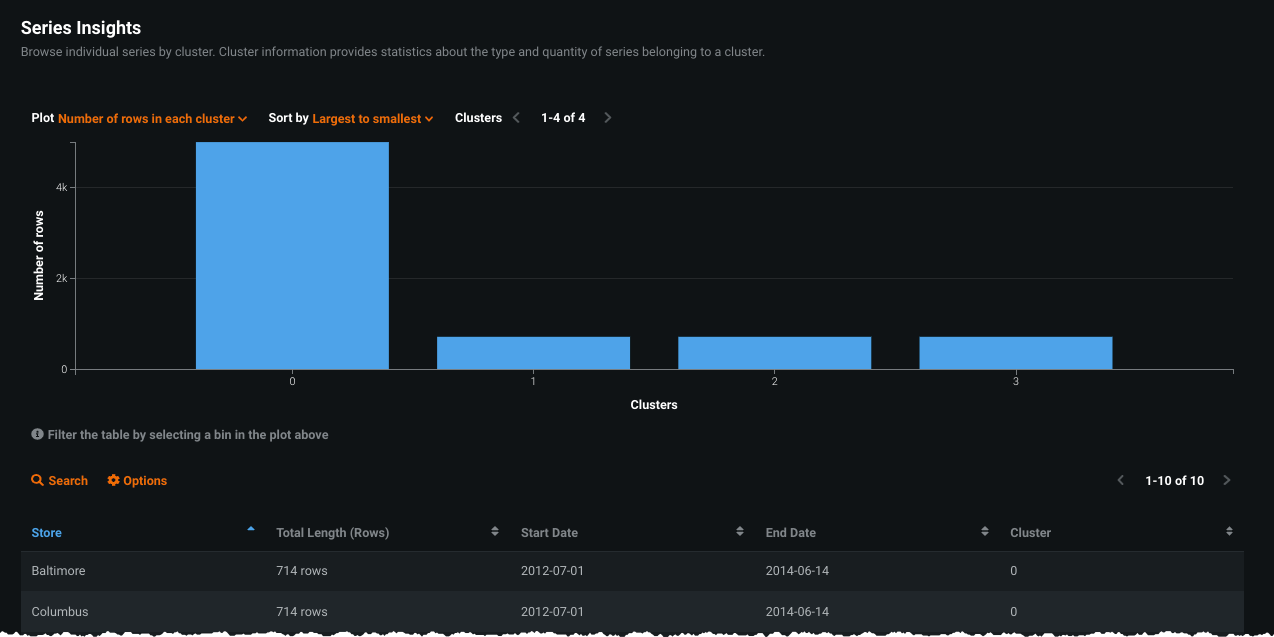
For multiseries, insights are reported in both charted and tabular format:
- The histogram for each cluster, which includes the number of series, the number of total rows, and the percentage of the dataset that belongs to that cluster.
- The table displays basic information for each series, such as row count, dates, and cluster membership.
Note that for large datasets, DataRobot computes scores and values after downsampling.
Use Series Insights
On first opening, the Series Insight chart displays a list of the series, sorted alphanumerically by series ID.
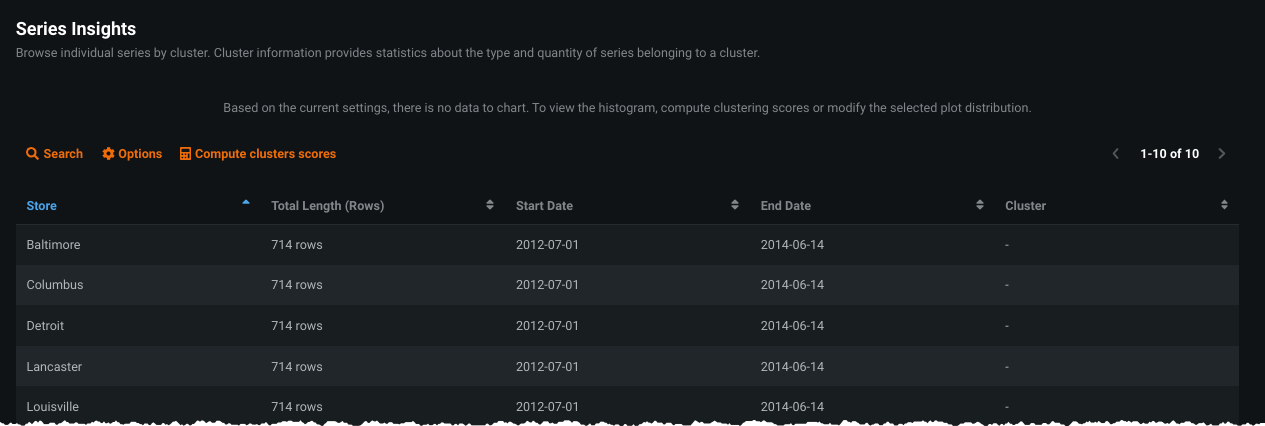
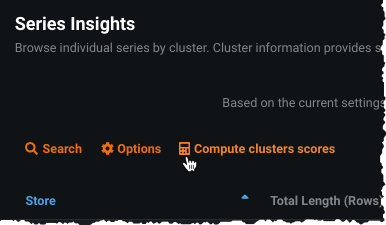
Click Compute cluster scores to run histogram calculations and populate the table for the current model:
Histogram
The histogram provides an at-a-glance indication of the make up of each cluster.
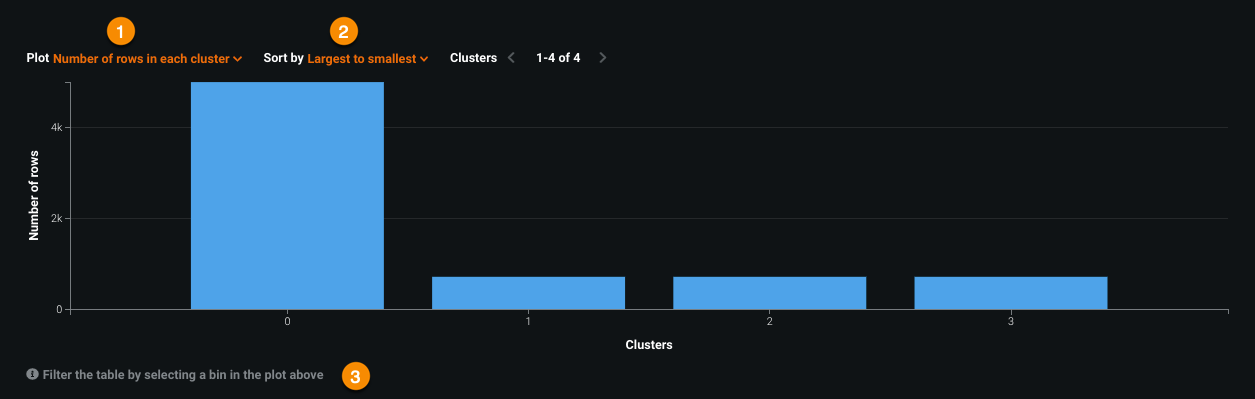
The following table describes the tools for working with the histogram:
| Element | Description | |
|---|---|---|
| 1 | Plot | Bins clusters by number of rows, percentage of total rows, or number of series in the cluster. To see all values, hover on a bin. |
| 2 | Sort by | Sets the sorting criteria for the bins. |
| 3 | Table filter | Filters the bins represented in the table below the histogram. |
Hovering on a bin displays the values for each of the plot criteria:
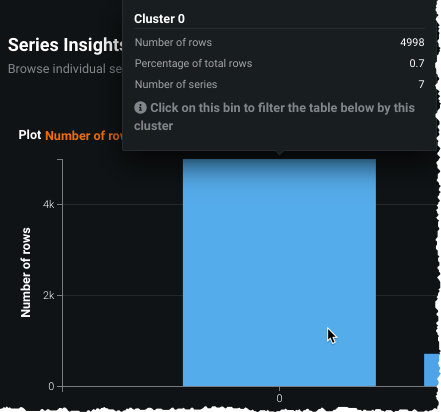
Table view
The table below the histogram provides cluster-specific information for all series in the project dataset or, if filters are applied from the histogram, for series related to the selected clusters.
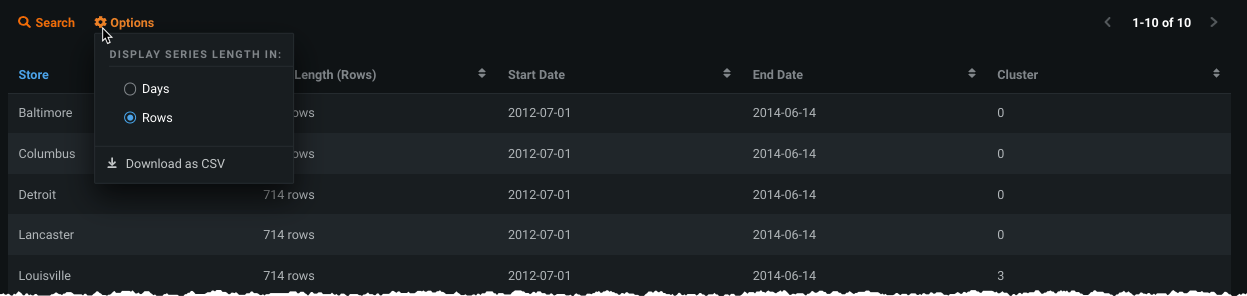
To work with the table:
- Use the search function to view metrics for any series.
- Use Options (
 ) to set whether the series length information is reported as a time step or number of rows. Additionally, you can download the table data.
 - Note that the start and end dates display the first and last timestamps of the series in the dataset.