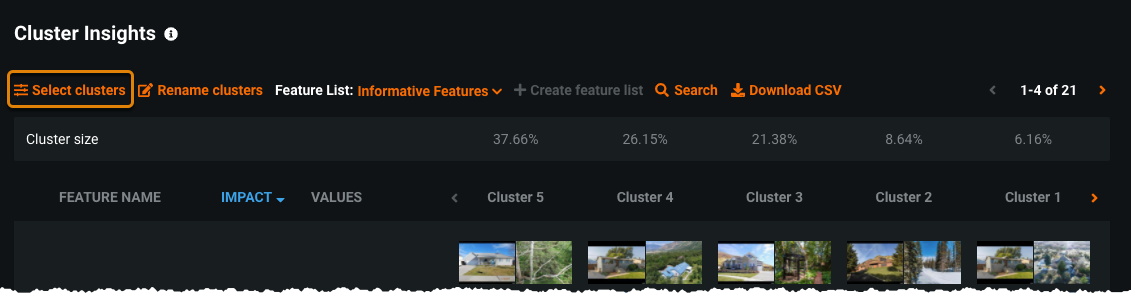
Cluster Insights
With the Cluster Insights visualization, you can understand and name each cluster in a dataset. Use clustering to capture a latent feature in your data, to surface and communicate actionable insights quickly, or to identify segments in the data for further modeling.
Note
The maximum number of features computed for Cluster Insights is 100. The features are selected from the features used to train the model, based on the Feature Impact (high to low). The remaining features (those not used to train the model) are sorted alphabetically.
To analyze the clusters in your data:
-
Build a clustering model and expand the model you want to investigate.
-
Select Understand > Cluster Insights.
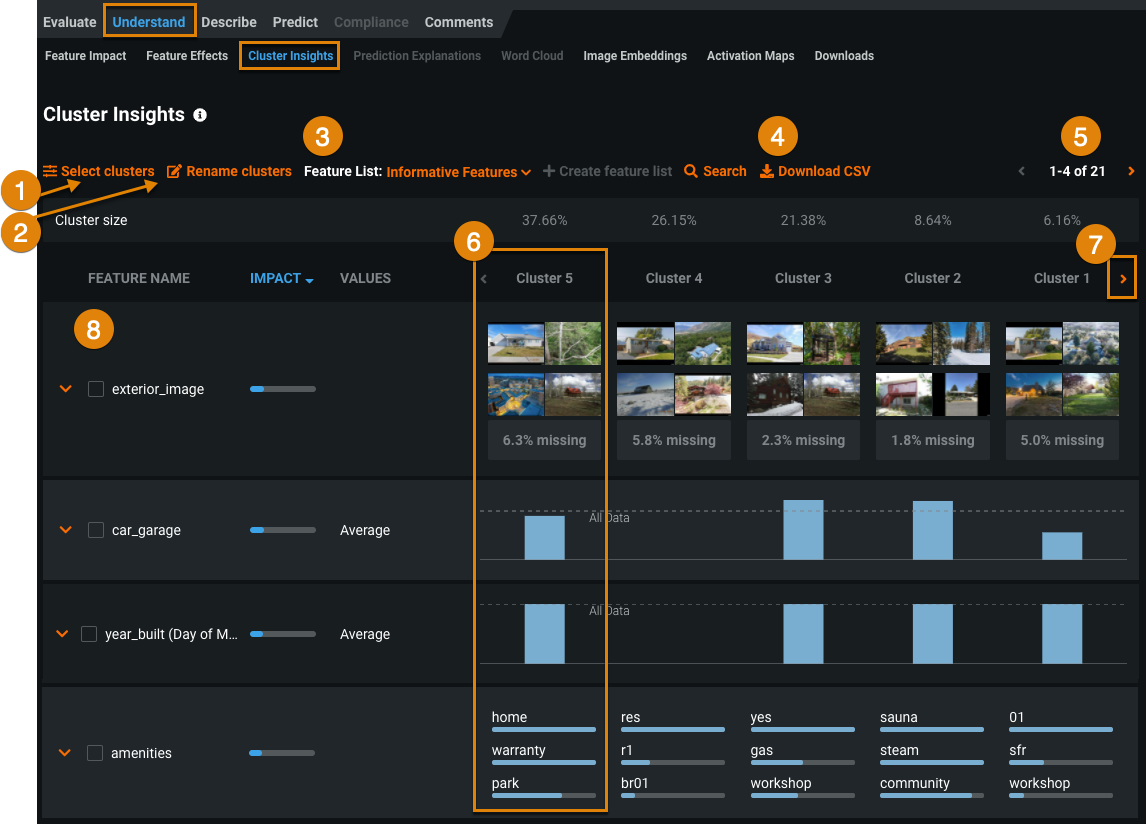
The following table describes the Cluster Insights visualization.
Element Description 1 Select clusters Click to select clusters to view or remove from view. 2 Rename clusters Name clusters after you gain an understanding of what they represent. 3 Feature List By default, DataRobot builds clustering models using the Informative Features list, although you can select another feature list to compare other features. Analyzing features not used to generate the clusters can still be useful, for example, to answer questions like "How does income distribute among my clusters, even if I'm not using it for clustering?" 4 Download CSV Click to download the cluster insights. The CSV contains the information displayed in the Cluster Insights visualization, and more detailed feature data. 5 Feature page control Page through to view more features. 6 Clusters Clusters display in columns of features (four features display by default). Cluster sizes are shown above (in percentages). Clusters are sorted by size from largest to smallest. 7 Cluster arrow Click to view more clusters. The rightmost cluster contains 100% as a baseline comparison. 8 Features Features are sorted by feature importance. The Informative Feature list displays by default, but you can select another feature list. -
Evaluate the distribution of descriptive features across clusters and the feature values in each cluster.
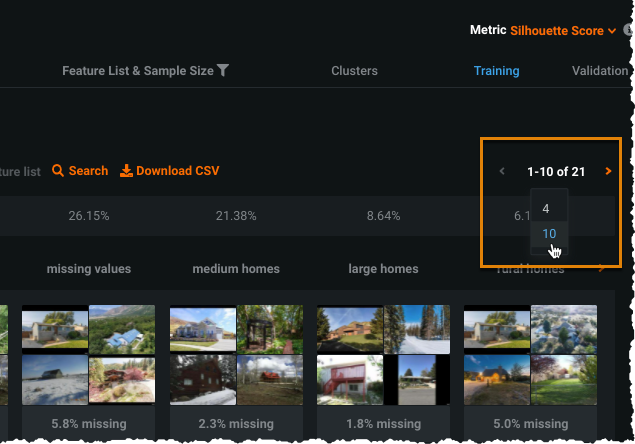
View features
The features display in order of Feature Impact (most important to least).
To page through the features, click the right arrow above the clusters:
![]()
The display defaults to four features but you can view 10 features at a time by clicking the feature page control and selecting 10:
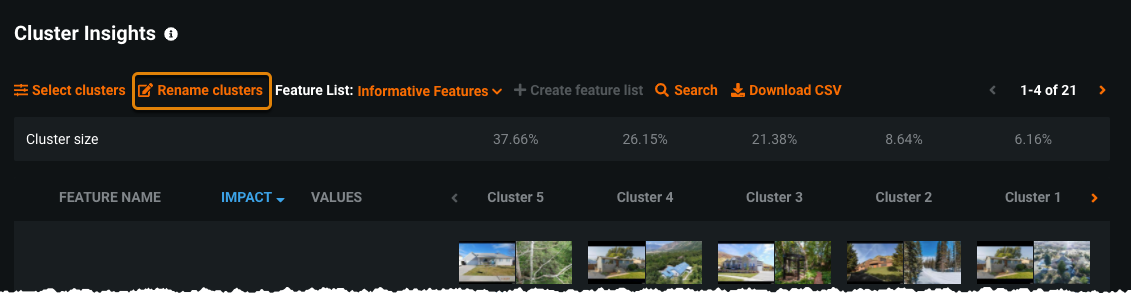
Name clusters
Once you get a sense of what your clusters represent, you can name them. Take a look at the data for obvious similarities and then name the cluster accordingly. The cluster names propagate to other insights and predictions, allowing you to further analyze the clusters.
-
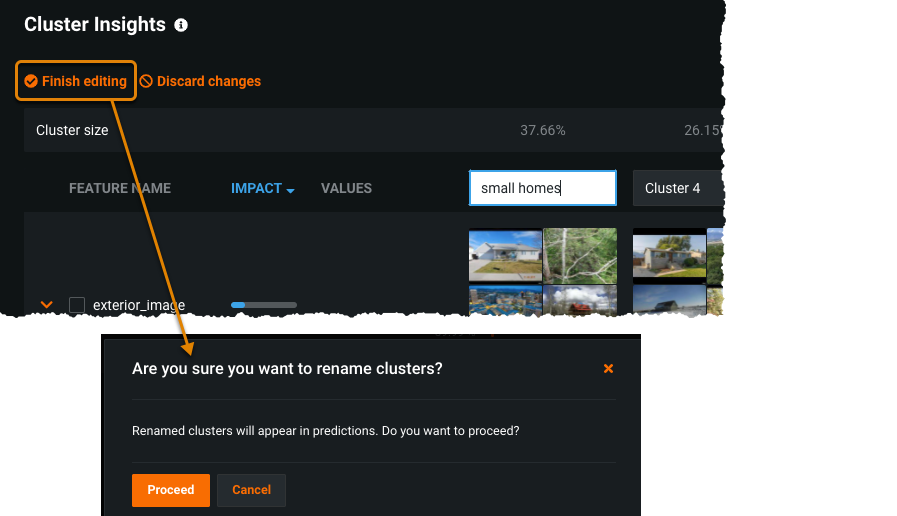
Click Rename clusters and enter names for each cluster.
-
Click Finish editing and click Proceed.
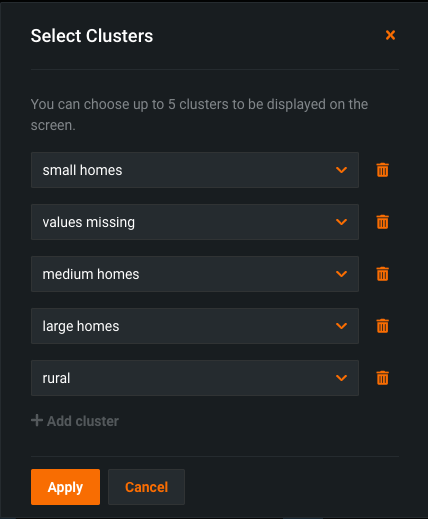
Add or remove clusters from the display
-
Click Select clusters to choose clusters to view or delete.
-
Click the down arrow to select a new cluster.
-
Click + Add cluster to display additional clusters.
-
Click the trash can icon to remove a cluster from the display.
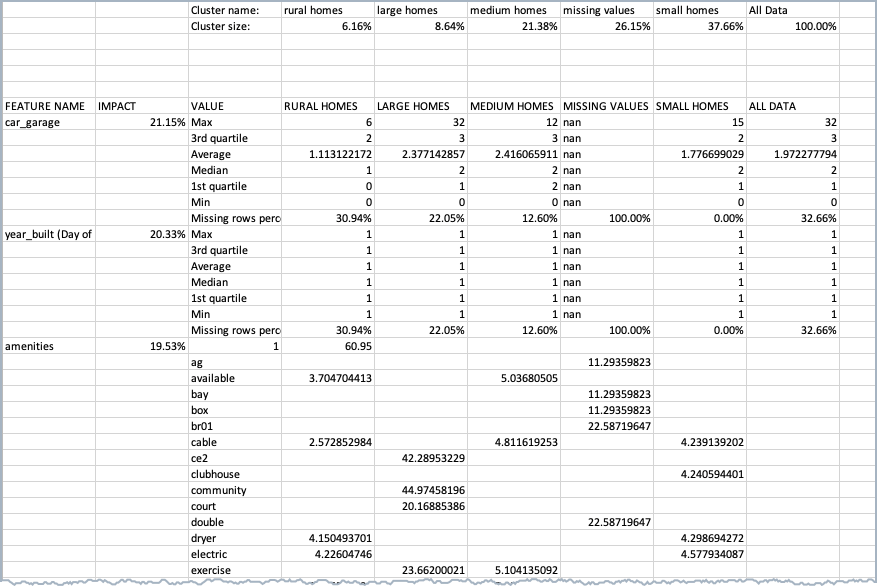
Download cluster insights
You can download the cluster insights as a CSV file for further analysis by clicking Download CSV above the clusters.
Investigate cluster features
The following sections show the visualization tools used to investigate cluster features. The sample dataset contains features representing housing data:
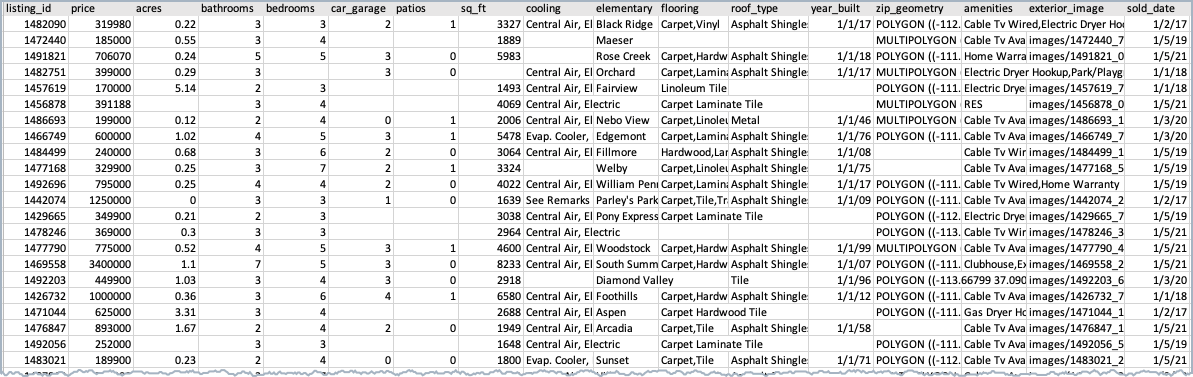
This dataset could be run in supervised mode with price as the target feature, but for clustering mode, no target is specified.
The dataset contains the following feature types:
- Numeric (
price,sq_ft, etc.) - Categorical (
cooling,roof_type, etc.) - Text (
amenities) - Image (
exterior_image) - Geospatial (
zip_geometry)
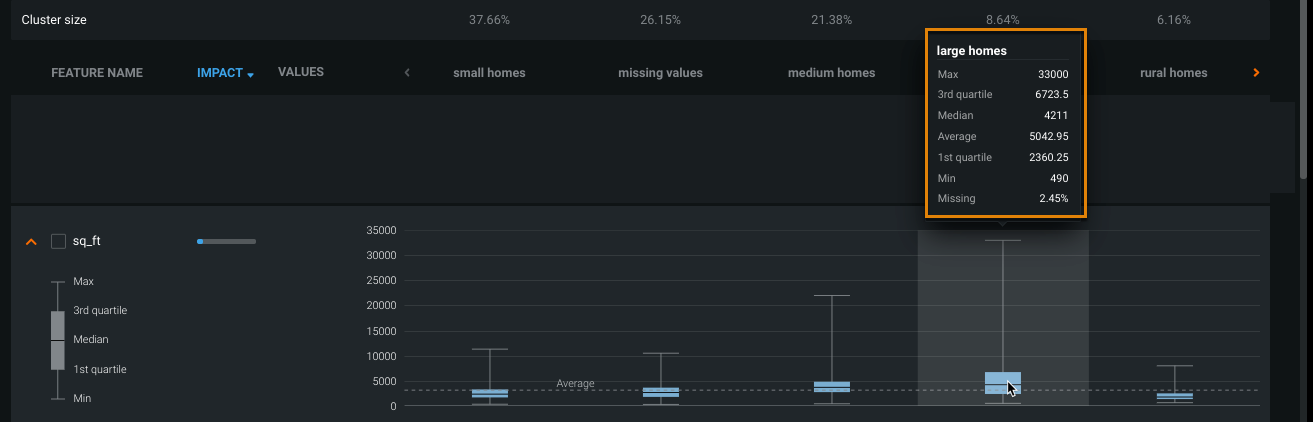
Numeric features
To view numeric features in Cluster Insights:
-
Locate a numeric feature on the Cluster Insights tab.

-
Click near the feature name to expand. Hover over the blue bar for each cluster to view the maximum, median, average, minimum, the percentage missing, and the 1st and 3rd quartiles.
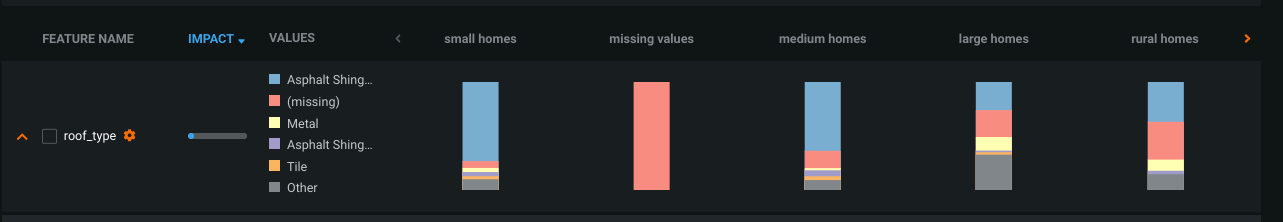
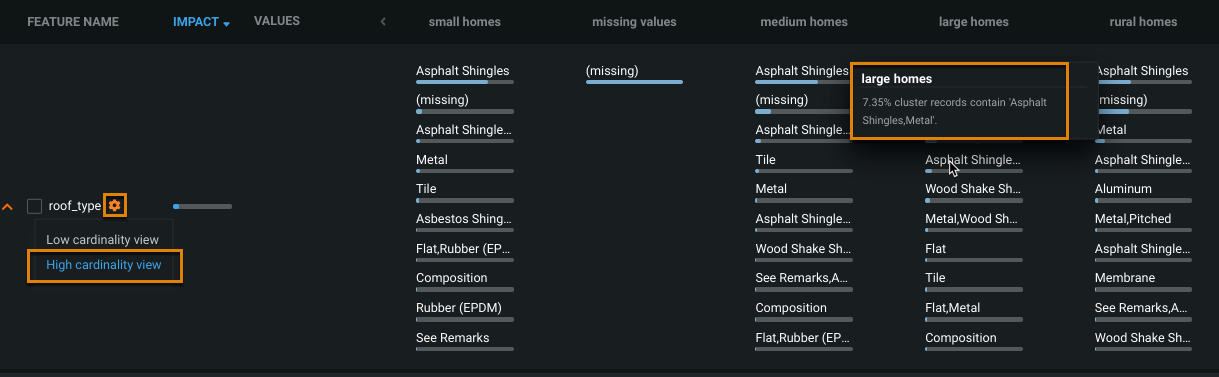
Categorical features
To view categorical features in Cluster Insights:
-
Locate a categorical feature on the Cluster Insights tab.
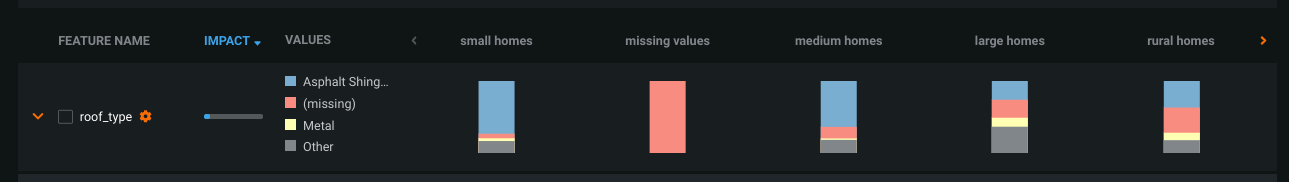
Low-frequency labels for the feature are grouped in the Other category. For example, if only a small number of houses in the dataset have
floor_typeengineered wood, houses with engineered wood would be grouped into the Other category for thefloor_typefeature. -
Hover over the bar for each cluster to see the breakdown within a cluster.
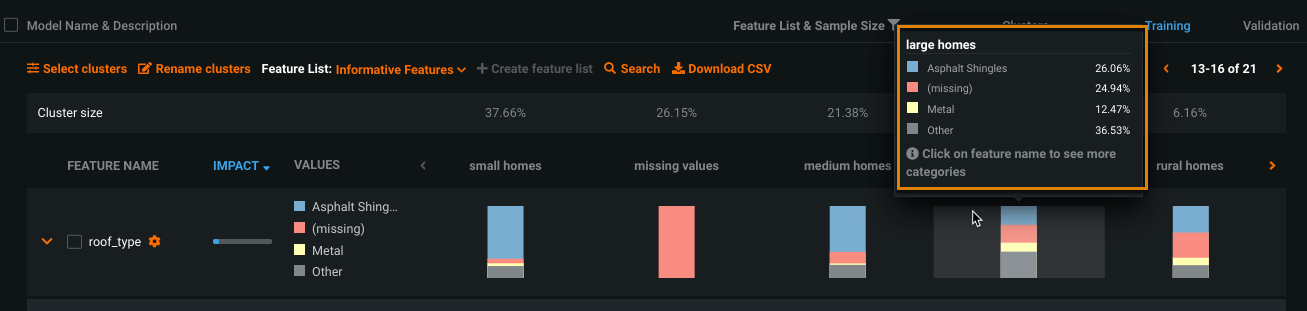
-
Click near the feature name to expand. This allows you to see more categories.
-
To drill into the categories, click the gear icon next to the feature name and select High cardinality view. Hover to see the percentage of records that have each value.
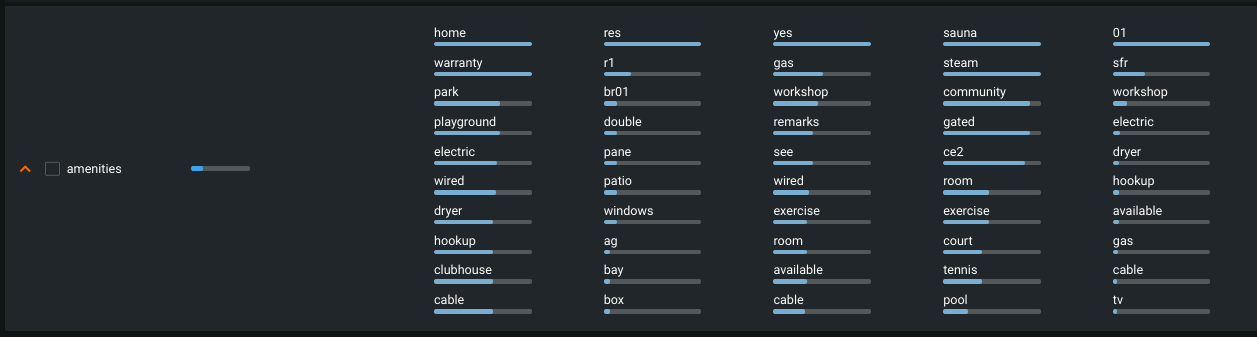
Text features
For text features, Cluster Insights shows n-grams ranked by importance (highest to lowest). These are displayed as blue bars that represent the relative importance. To see the actual importance value, download the CSV.
Deep dive: Calculating importance scores
Importance scores are an estimation, computed using an adaptation of the TF-IDF method. The basis of the methodology is:
- N-grams that are common in every cluster will have lower importance.
- N-grams that are common in a specific cluster, but missing or rare in other clusters, will have higher importance for the specific cluster.
- The importance score is robust to clusters with different numbers of rows.
- N-grams that frequently occur only in a single example in a cluster will not skew the importance higher.
Specifically, the estimation method used to compute the importance works as follows. Consider, for example:
How frequent is n-gram j in cluster i?
frequency_j_i = (num of docs containing n-gram j in cluster i ) / (num of docs in cluster i)
Now, How frequent is n-gram j in another average cluster k?
frequency_j_not_i = [(num of docs containing n-gram j not in cluster i) + 1] / [(num of docs not in cluster i) * (num of clusters - 1)]
Finally:
importance of n-gram _i_ in cluster _j_ = frequency_i_j / frequency_j_not_i
In the CSV download, the values associated with the text feature column will show the entire list of n-grams that exist in the dataset. If the n-gram exists for a cluster, it will contain an importance value; if it doesn't exist in the cluster, the importance field will be blank.
-
Locate a text feature on the Cluster Insights tab. Click near the feature name to expand.
Note
Missing values impute blanks;
blankis included as an n-gram if the missing values are scored as important. -
Hover over an n-gram in a cluster to view sample strings that contain the word.
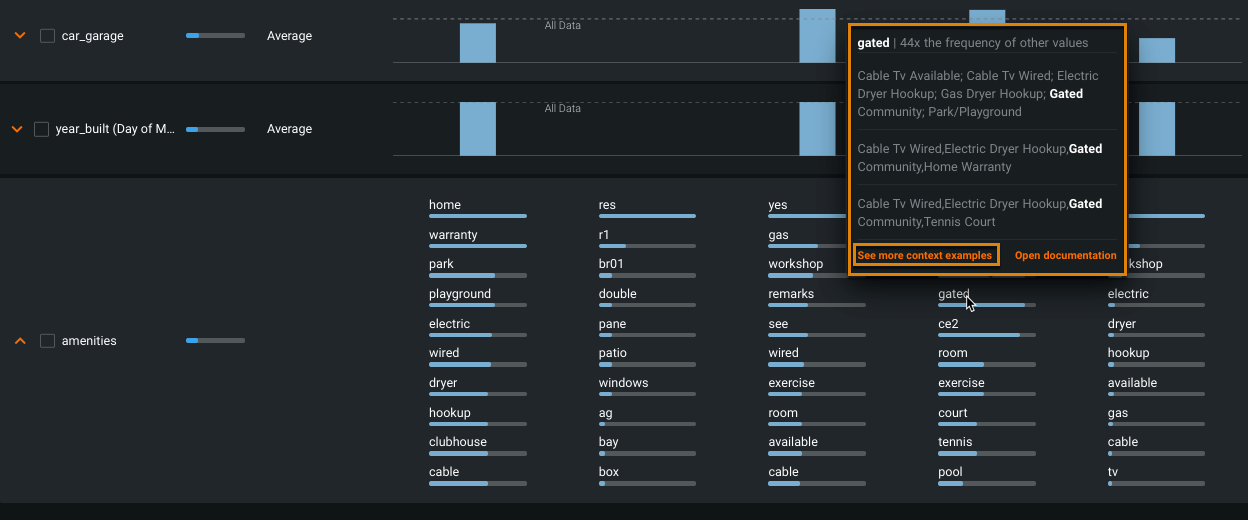
-
Click See more context examples to drill down.
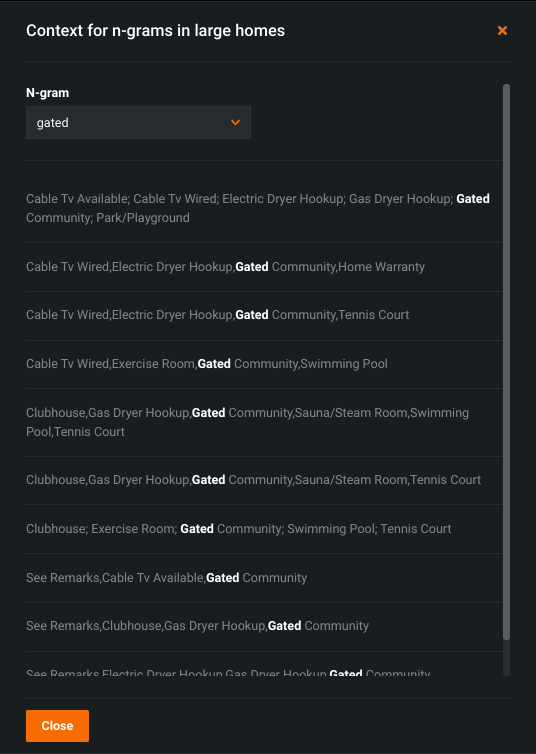
The Context window displays ten random excerpts that contain the n-gram.
Image features
For image features, Cluster Insights displays sample images from each cluster. DataRobot uses the Maximal Marginal Relevance criterion to choose images that are representative of the cluster, but also diverse within the cluster (so not all from the centroid of the cluster).
-
Locate an image feature on the Cluster Insights tab. By default, four images are displayed. Click near the feature name to show 10 images.
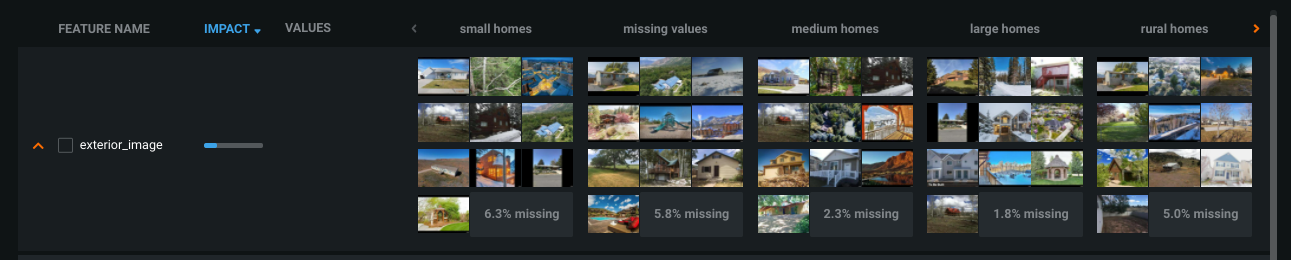
-
Hover over an image to zoom in.
Geospatial location features
To see a map of a geospatial location feature:
-
Locate a geospatial feature on the Cluster Insights tab.
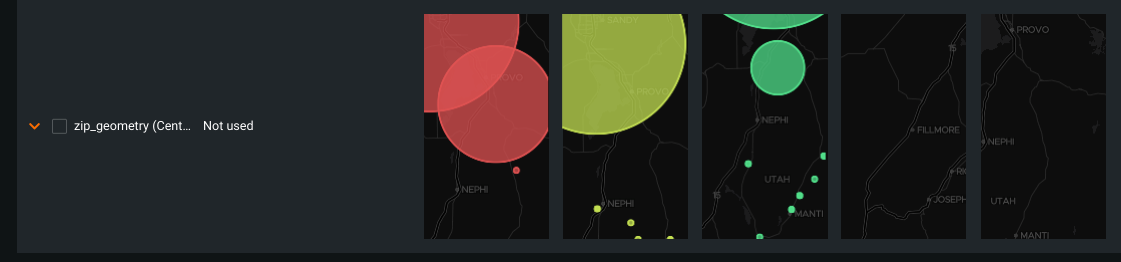
DataRobot uses the Maximal Marginal Relevance criterion to transform geospatial data to points.
Tip
DataRobot derives numeric features (such as area and coordinates) from geospatial features. Often the derived features appear in the Informative Features list, while the original geospatial feature does not. To view the geospatial map of the original geospatial feature, select All Features from the Feature List dropdown and locate the feature.
-
Click near the feature name to expand the map:
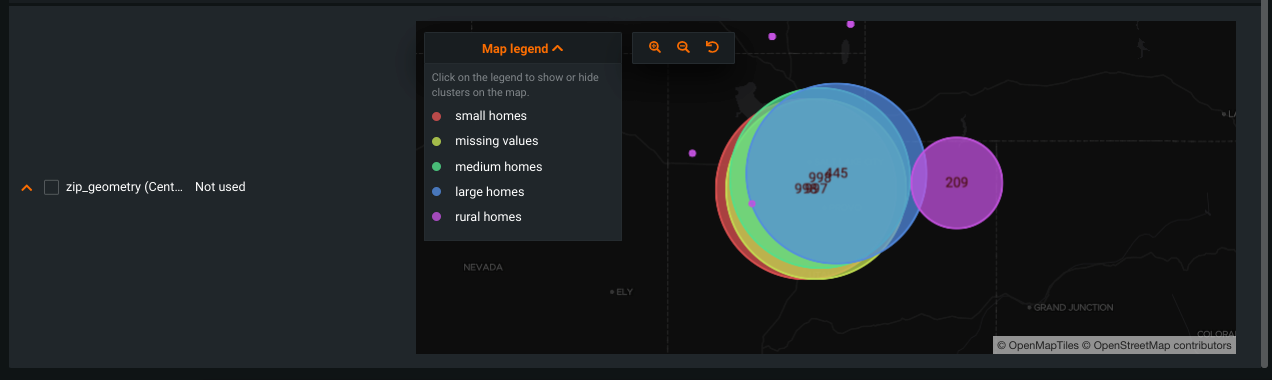
To view individual clusters, click the Map legend and click cluster names to hide clusters. The map visualization includes zoom buttons.